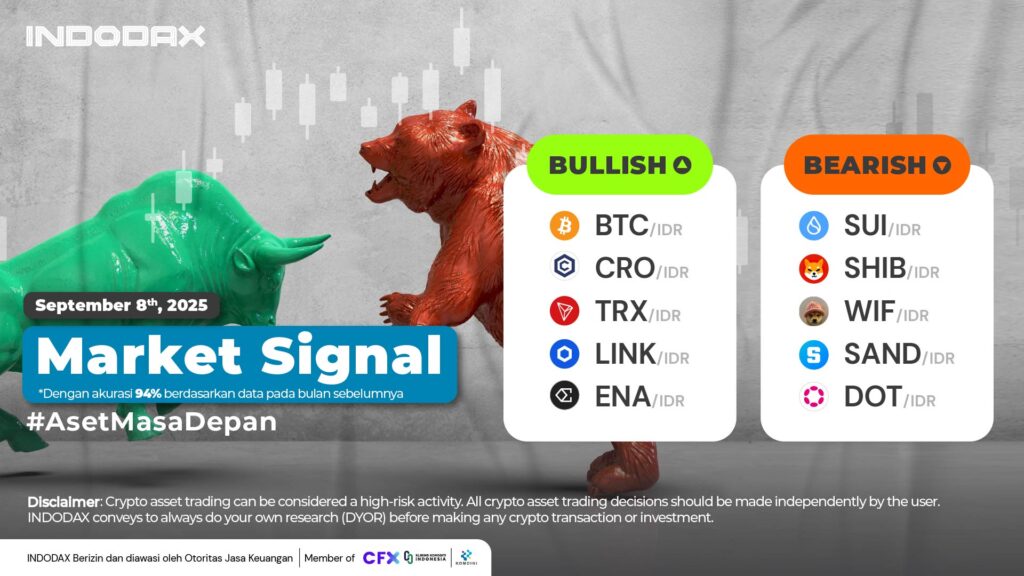
This week, the bullish crypto lineup is led by Bitcoin (BTC) in first place, followed by Cronos(CRO) and Tron(TRX).
Want to know how your favorite crypto asset is performing? Check INDODAX Market Signal below!
5 Bullish Crypto Assets
1.Bitcoin (BTC)

If we look at the movement of Bitcoin (BTC) some time ago, Bitcoin (BTC) has not succeeded in passing the Resistance of 1,930,000,000 – 2,000,000,000. Currently, Bitcoin (BTC) is still moving below the WMA/75, weakening towards the level of 1,550,000,000 – 1,650,000,000.
2.Cronos (CRO)

The positive trend change is inseparable from the success of Cronos (CRO) in moving to stay above the EMA/200, providing a positive response to the strengthening of the price of Cronos (CRO) which had touched the price range of 6,350.
3.Tron (TRX)

The weakening will continue if the candle fails to stay above the EMA/85, but this will fail if the resistance of 5,500 – 6,500 is broken.
4.Chainlink (LINK)

The trend is moving in a negative direction, the MACD indicator predicts this after the lines available on the indicator cross downwards, weakening will allow Chainlink (LINK) to test the 310,000-345,000 area.
5.Ethena (ENA)

The Ethena (ENA) Resistance Level is available in the price range of 12,500 – 14,000. If the candlestick remains above this price, it can strengthen the bullish trend.
5 Bearish Crypto Assets
1.Sui (SUI)

The 4-hour timeframe indicates that Sui (SUI) has been in a bearish phase since August 24, 2025. Further weakening will lead to further bearish dominance of price movements, with further weakening likely to test the 50,000-55,000 area.
2.Shiba Inu (SHIB)

The Shiba Inu (SHIB) trend shows that the Bearish trend still dominates the direction of trend changes, the movement of Shiba Inu (SHIB) on the MACD indicator has not changed much with prices dominating the Sideways phase.
3.dogwifhat (WIF)

Resistance of 15,000 – 20,000 is a crucial price point. An increase in this level will have a positive impact on the change in the dogwave (WIF) trend.
4.The Sandbox (SAND)
 A trend improvement will allow The Sandbox (SAND) to move towards the 6,000-8,000 area if the EMA/20 is realized, it will experience negative pressure where the Bearish will experience the same thing.
5.Polkadot (DOT) 

Polkadot (DOT) is still being held back by the WMA/85, with support available in the 50,000-60,000 range. A breakout would increase the potential for a trend reversal.
NOTE: If the 5 EMA crosses the WMA 75, 85 and 200 EMA lines and the lines intersect from the bottom up, then the market trend tends to go up (bullish), each table above shows that if the 5 EMA value is higher than the 75.85 WMA and 200 EMA, the market tends to go up (bullish).
If the RSI and MACD values ??show the same condition, it means that the market is showing the same trend. Overbought or oversold conditions are an indicator that the market is already at the point of changing direction of a trend.
ATTENTION: All contents which includes text, analysis, predictions, images in the form of graphics and charts, as well as news published on this website, is only used as trading information, and is not a recommendation or suggestion to take action in transacting either buying or selling. certain crypto assets. All crypto asset trading decisions are independent decisions by the users. Therefore, all risks arising from it, both profit and loss, are not the responsibility of Indodax.
 Market