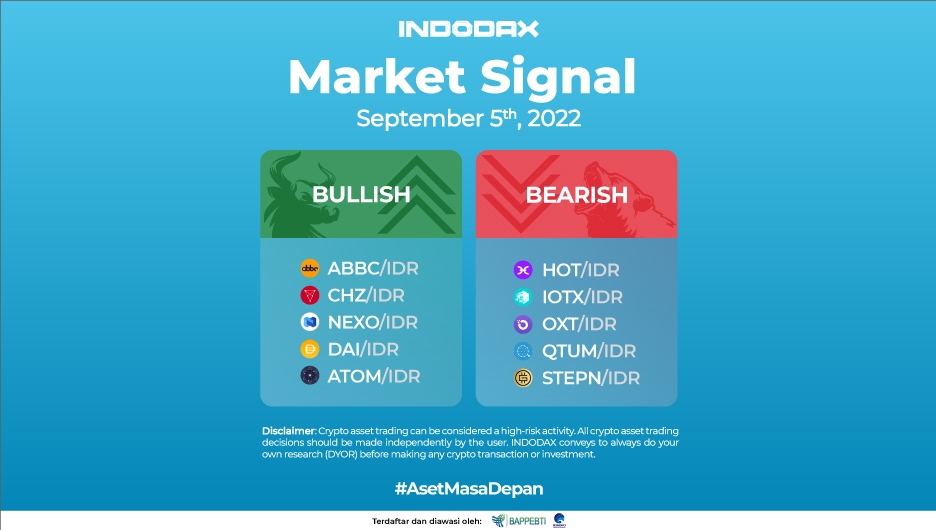
In this week’s market signal we have ABBC Coin at the top of the list of bullish crypto assets. Check out the full review below!
5 Bullish Crypto Assets
-
ABBC Coin (ABBC)
It touched the 3.345 price level but the trend was unable to continue strengthening because the RSI indicator shows that the price is already in the overbought area and is experiencing a correction trying to break through WMA/75 and WMA/85, if this support level is broken then the candle will try to stay above 2,440 – 2,470 levels.

On a 4-hour candle, the trend is above the EMA/200 at a price of 2,290 which indicates that the current trend is still on the uptrend channel, the trend will strengthen if buying can still dominate the price.
-
Chiliz (CHZ)
The CHZ has been moving in the bullish direction since July 19, 2022, but was only confirmed positive for strengthening on July 28, 2022 when it was able to break out of the fairly strong resistance level at 1.755 – 1.790.

Indications of bearish sideways are seen at the current price and also on the Bollinger Bands indicator, both lines are narrowing so that the price will move more limited in the price range of 2,950 – 3,400.
The uptrend will continue if the price does not break the EMA/200 at the level of 2,800. When it is broken, it will test the price of 2,400.
-
Nexo (NEXO)
After breaking through the EMA/200, the NEXO was having a correction but the price is in a positive direction because it stays above 9,100 and 10,000, thus confirming the occurrence of a bullish phase. Resistance level will increase if the candle is able to rise and penetrate the price level of 18,630-18,700.

The MACD indicator on the 4-hour price chart is on the positive line. The price will weaken if NEXO is unable to penetrate the 17,000 level. The closest support level is at 13,700, and at 11,270 – 11,900.
-
Multi-collateral DAI (DAI)
It weakened and touched 14.365 and even break through the EMA/200, but the price bounced and strengthened instead, because the candle touched the support level at 14.350. When viewed on the 1-day time frame, there is a candle axis which can indicate the pressures or buy and sell on the DAI Multi-collateral.

The trend is positive after the MACD indicator is in the positive zone while the RSI indicator still needs more time to confirm the next direction. Strong indication of bullish trend will continue if it is able to break the resistance level at 15.050.
-
Cosmos (ATOM)
Cosmos has been in a bullish trend since July 07 2022, starting when the candle was able to break through and stayed at 129,000, followed by EMA/5, WMA/75 and WMA/85 which crossed above the EMA/200. The price had broken through the EMA/200 several times but rebounded, one of which was caused by the failure to break the 150,000 level.

The resistance level is at the price of 200,000 if this price is able to be broken then ATOM will try to break out the EMA/200 and the resistance level of 250,000. The RSI indicator illustrates if the trend is not yet in the overbought area.
The closest support level is at the level of 173,000, if this level is broken, the next level is at 165,000.
5 Bearish Crypto Assets
-
Holo (HOT)
Unable to stay above 36 level, it experienced a breakout and weakened to touch the level of 30, so Holo is in a new phase, bearish. The MACD indicator signaled that the trend is in a positive direction after being in the positive histogram area.

The bearish phase will be broken if the price is able to break through the 34 level then followed by staying above the EMA/200.
-
IoTeX (IOTX)
It had weakened since August 17, 2022, after touching the 630 level and then experiencing a correction through the WMA/75 and WMA/85 and hit the 510 level. On the 4-hour chart it broke through the EMA/200 several times, but no intact candle was formed. The correction will continue if it is unable to break the 530 level.
When viewed from the IoTeX candle shape, the sideways bearish phase is happening, this is in line with the Bollinger Bands indicator where both lines are narrowing, price movement is limited to the range 430 – 465.

-
Orchid (OXT)
The Orchid Candle on the 1-day chart has experienced bearish since January 12, 2022, the weakening that occurred from the beginning of the bearish phase to date has dived to reach the 80% range. If the price is able to break through the price of 2.750 then the bearish phase will likely continue.
The Bollinger Bands indicator signaled that it is currently in the bearish sideways area, in line with the MACD indicator, the two lines are narrowing, the price is moving in the range of 1.455 – 1.995.

-
Qtum (QTUM)
The 1-day chart movement shows that the price of QTUM/IDR has experienced a deep weakening, which was marked by the downtrend phase that had occurred since January 09, 2022. It touched 245,000 on November 30 but the price dropped through the support level at 170,000 to penetrate 80,000.
A fairly high strengthening must occur to change the direction of the trend, there are several resistance lines with the closest one at the level of 55,000, and the next at the range of 79,000 – 80,000.

-
GMT (STEPN) ??
The MACD indicator illustrates that STEPN is having a constriction, the sideways bearish phase is occurring with the price moves in the range of 9,600 – 10,600. The downtrend phase will change direction if STEPN is able to strengthen and penetrate the 12,700 – 13,000 level, but before that, it must first pass several resistance levels such as 11,000 and 12,300.

NOTE: If the 5 EMA crosses the WMA 75, 85 and 200 EMA lines and the lines intersect from the bottom up, then the market trend tends to go up (bullish), each table above shows that if the 5 EMA value is higher than the 75.85 WMA and 200 EMA, the market tends to go up (bullish).
If the RSI and MACD values ??show the same condition, it means that the market is showing the same trend. Overbought or oversold conditions are an indicator that the market is already at the point of changing direction of a trend.
ATTENTION: All contents which includes text, analysis, predictions, images in the form of graphics and charts, as well as news published on this website, is only used as trading information, and is not a recommendation or suggestion to take action in transacting either buying or selling. certain crypto assets. All crypto asset trading decisions are independent decisions by the users. Therefore, all risks arising from it, both profit and loss, are not the responsibility of Indodax.


 Polkadot 10.19%
 BNB 1.21%
 Solana 4.89%
 Ethereum 2.37%
 Cardano 1.64%
 Polygon Ecosystem Token 2.07%
 Tron 2.90%
 Market


