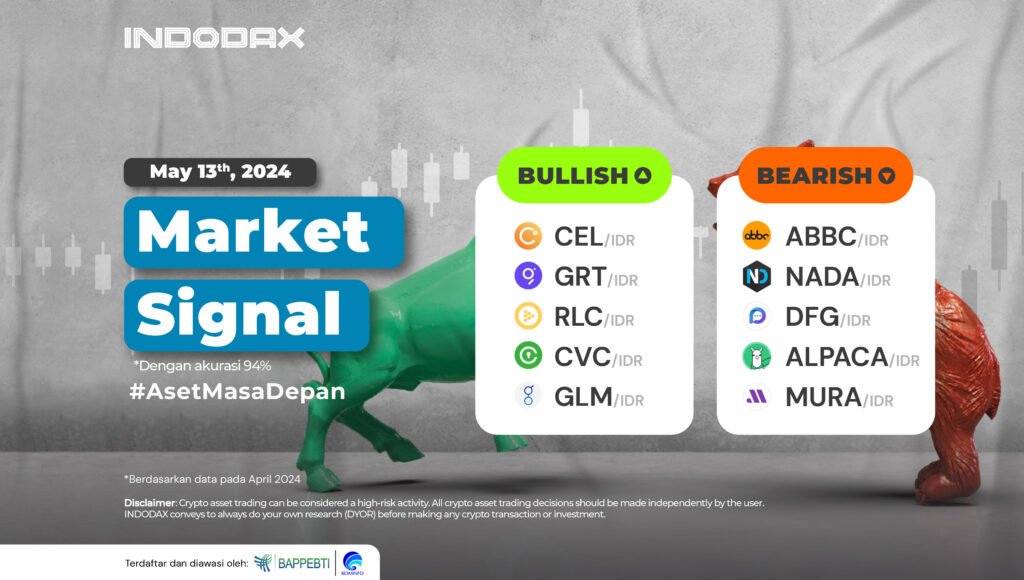
The performance of Celsius (CEL) to Golem (GLM) strengthened and managed to enter the ranks of bullish crypto assets this week.
Curious about what crypto assets are experiencing bullish or bearish trends this week? Check out the full INDODAX Market Signal update below!
5 Bullish Crypto Assets
1. Celsius (CEL)

Celsius (CEL) has experienced a massive price increase, which aligns with the current bullish trend. However, the MACD indicator indicates that the current trend is negative. Currently, Celsius (CEL) may be in the range of 12,500-17,500 area, confirming the direction of Celsius (CEL)’s next move.
2. The Graph (GRT)

Weakness had occurred several times testing the EMA/200 until the price of The Graph (GRT) managed to survive, and caused the price to bounce but indicated a fairly strong support area around the 3,300-4,000 area, where if it is broken, the chances of the EMA/200 being passed will be very large to occur.
3. iExec RLC (RLC)

Currently, the iExec RLC (RLC) trend is on a positive path, supported by candles that can hold above the WMA/75. Then, MACD also depicts the same thing. The bullish trend will further dominate if a candle can be created above the 70,000-75,000 area.
4. Civic (CVC)

If we look at the candle shape and the Bollinger Bands indicator, Civic (CVC) can be estimated to be in a Bullish Sideways phase with a price movement range in the range of 2,300-3,300 EMA/200 will be the closest support for Civic (CVC) if support is broken.
5. Golem (GLM)

It had strengthened to touch the price of 24,000 but did not last long; this is the highest price for Golem (GLM) since listing on INDODAX. The bullish trend is expected to continue. If a candle can form above the 10,500-12,500 area, the price will continue, but on the contrary, if the price range is 4,700-5,500, then the opportunity for a bearish trend to occur is quite large.
5 Bearish Crypto Assets
1. ABBC Coin (ABBC)

ABBC Coin (ABBC) has been unable to fix the price in the bearish trend. The candles did not react positively to the WMA/75 line and followed the direction of movement of the line. If you want to suppress the bearish trend, ABBC Coin (ABBC) must pass the nearest resistance in the 410-550 area.
2. NADA Protocol Token (NADA)

NADA Protocol Token (NADA) is still indicated to be in a deep bearish trend, with weakness will continue. Still, if the 110-130 area can be broken, NADA Protocol Token (NADA) has a chance to move above the WMA/75 line.
3. Defigram (DFG)
 When looking at the shape of the chart, it can be seen that Defigram (DFG) has high price fluctuations, where support and resistance are often broken. The bearish trend cannot be continued if candles form above the 44,000-48,000 area, but on the contrary, the 26,000-28,000 area being broken will make the bearish trend even stronger.
4. Alpaca Finance (ALPACA)

Alpaca Finance (ALPACA) has been in a bearish trend since April 15, 2024, causing the price to decline by more than 20%. Alpaca Finance (ALPACA) is moving sideways and bearish, as shown by the MACD indicator. The moving range of 2,400-3,400 is quite wide for Alpaca Finance (ALPACA), but if one is broken, it may have a significant effect.
5. Murasaki (MURA)
 The MACD indicator on the 4-hour timeframe estimates that the Murasaki (MURA) trend is positive. Still, it is not in line with the movement of Murasaki (MURA), which shows limited strength. A stronger price and a break of the 14,000-16,000 resistance would positively make the WMA/85 cut.
NOTES:
If EMA 5 crosses the WMA 75, 85, and EMA 200 lines, and these lines intersect from bottom to top, then the market trend tends to be upward (bullish).
Each table above shows that when the value of EMA 5 is higher than WMA 75,85 and EMA 200, the market tends to rise (bullish).
If the RSI and MACD values show the same condition, the market is showing the same trend; an overbought (overbought) or oversold (oversold) condition indicates that the market is at the point of changing trend direction.


 Polkadot 10.84%
 BNB 0.3%
 Solana 5.23%
 Ethereum 1.84%
 Cardano 1.25%
 Polygon Ecosystem Token 1.93%
 Tron 2.39%
 Market


