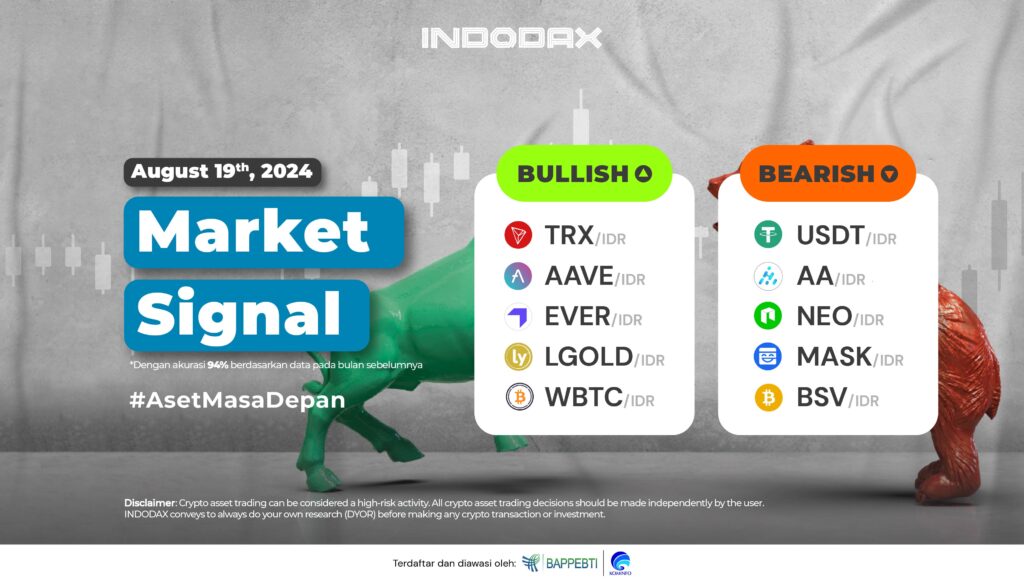
This week, the ranks of bullish crypto assets are led by Tron (TRX) in the first position, and followed by Aave (AAVE) and Everscale (EVER).
Want to know the performance of your favorite crypto assets? Check INDODAX Market Signal below!
5 Bullish Crypto Assets
1. Tron (TRX)

Can survive above the EMA / 200 but the price is still indicated to not be able to break the Resistance 2,100 – 2,250 makes Tron (TRX) still have a chance to be able to strengthen higher in the Bullish zone. The line on the MACD indicator has cut positive, the opportunity becomes greater for Tron (TRX).23
2. Aave (AAVE)

The 4-hour chart illustrates that Aave (AAVE) is in a new Bullish phase, crossing the 1,550,000 – 1,650,000 area confirms the new phase. Bullishness will further dominate the price change if a candle can be created above the 1,750,000 – 1,930,000 area.
3. Everscale (EVER)

Everscale (EVER) has been in a Bullish phase since June 07, 2024, but the Bullish will experience negative pressure if the 600 – 780 area can be broken and make the MACD indicator will confirm a negative crossover.
4. Lyfe Gold (LGOLD)

Touching the price of 1,030,000 the price has weakened, the trend is still indicated to be in a positive area WMA / 85 moves above EMA / 200. A candle that breaks the price of 1,050,000 will make Lyfe Gold (LGOLD) touch the highest price in 2024.
5. Wrapped Bitcoin (WBTC)

Currently the candle is indicated to move below the EMA/200 this will have a negative impact on the trend that is happening, Support is indicated in the range of 750,000,000 – 820,000,000 the Bullish trend will be threatened if Support can be passed.
5 Bearish Crypto Assets
1. USDT (USDT)

USDT (USDT) has weakened by more than 2% after being in the Bearish phase, had touched the price of 16,950 which is the highest price of USDT (USDT) since April 2024. The weakening trend of USDT (USDT) will deepen, Support 15,500 – 15,650 is the decisive support for the direction of the next trend.
2. Alva (AA)

The price weakness of Alva (AA) occurred quite significantly, listing on indodax on March 21, 2024 and touching its highest price in the range of 140,000,000 but currently corrected by 80%. Resistance area is at 760,000 – 1,200,000 if broken allows the trend to be able to move above EMA/200.
3. Neo (NEO)

Bearish trend has occurred on Neo (NEO) starting July 09, 2024, has weakened the trend by more than 20%. There is an indication of a fairly dominant Support area at the price of 100,000 – 125,000 with the break of this area the Bearish trend will be even stronger.
4. Mask Network (MASK)

Candles that form below the 60,000 – 70,000 area ensure that Mask Network (MASK) will move in the Downtrend phase. The lowest price of Mask Network (MASK) was formed as one of the impacts of this Downtrend, with strengthening that will occur testing the price of 43,000 – 50,000.
5. Bitcoin SV (BSV)

Strengthening prices in the current Bearish trend are held back by the WMA / 85, if it can be passed then the price will try to go to the 920,000 – 1,100,000 area while on the contrary with the unsuccessful trend to strengthen the price will turn around to test Support 430,000 – 53,000.
NOTES:
If the EMA 5, crosses the WMA 75, 85 and EMA 200 lines, and the lines intersect from bottom to top, then the market trend is upward (bullish).
Each table above shows that if, the value of EMA 5 is higher than WMA 75, 85 and EMA 200, then the market is trending up (bullish).
If the RSI and MACD values show the same condition, it means that the market is showing the same trend, overbought (overbought), or oversold (oversold) conditions are one indicator that the market is at the point of changing the direction of the trend.
 Market