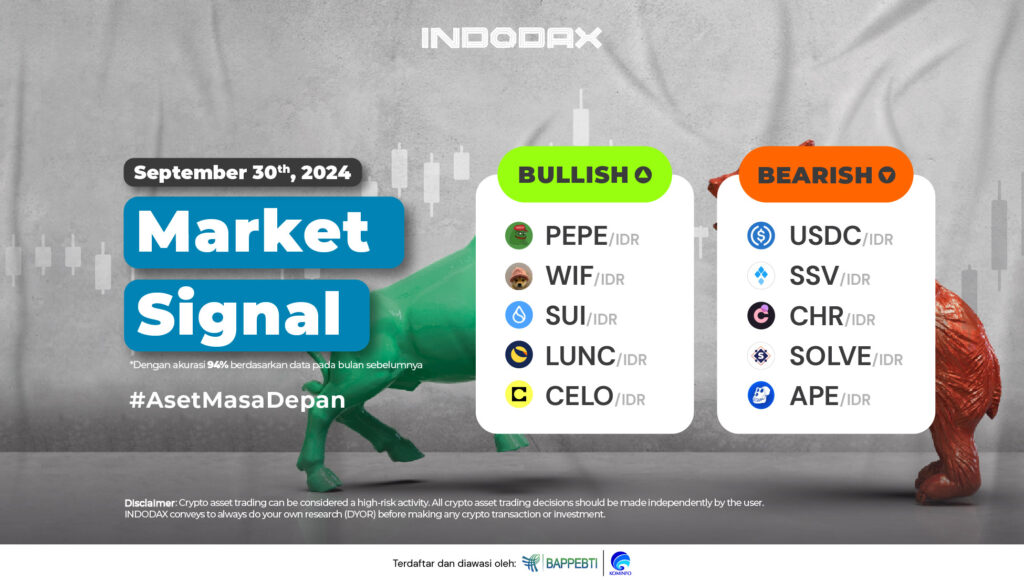
This week, the bullish crypto lineup is led by Sui (SUI) in first place, followed by TURBO (TURBO) and Fantom (FTM).
Want to know how your favorite crypto asset is performing? Check INDODAX Market Signal below!
5 Bullish Crypto Assets
1. Sui (SUI)

Looking at the price movements that occurred in Sui (SUI) shows that the trend is in a positive phase, has occurred since September 15, 2024. The current trend of Sui (SUI) is described by the RSI indicator as being in the Overbought phase, indicating Resistance will test the strength of the price in the range of 28,000 – 32,000.
2. TURBO (TURBO)

The MACD indicator managed to cut the line up so that the price of TURBO (TURBO) showed a positive intersection, and had an impact on the trend that managed to stay above the EMA/200. Weakness will test the strength of the Support level which is in the range of the WMA / 85 line.
3. Fantom (FTM)

Fantom (FTM) is still on a Bullish path, the price moves above the WMA / 75 and even strengthening has a positive impact on trend changes such as the passing of the Resistance area of 7,500 – 8,500.
4. ShredN (SHRED)

It is estimated that negative pressure will be able to form if the candle moves below the EMA/200, then supported by Support 12,500 – 13,800 which cannot withstand price weakness on ShredN (SHRED).
5. Aave (AAVE)

The price movement of Aave (AAVE) is estimated by the Bollinger Bands indicator if the price can change volatile enough, the candle tries to move outside the available lines. Resistance is available in the range of 2,700,000 – 3,450,000 area.
5 Bearish Crypto Assets
1. Hedera Hashgraph (HBAR)

Hedera Hashgraph (HBAR) is under negative pressure, this will be able to be corrected with the break of the WMA / 85 which must be followed by several Resistance passed such as 900 – 1,100 and the crucial area of 1,400 – 1,600 will also have an impact on the Bearish trend under pressure and the opportunity for Bullish is quite large.
2. Litecoin (LTC)

When viewed from the chart chart with a time of 1 Day, it is indicated that Litecoin (LTC) has decreased by 15% since July 10, 2024. Litecoin (LTC) will be able to correct the price weakness if it is able to break the price of 1,050,000 – 1,100,000 with the estimated WMA / 85 will be passed.
3. Polkadot (DOT)

Indicated Resistance area that dominates 70,000 – 95,000 if this area can be broken will make the opportunity for Polkadot (DOT) to break EMA/200 even greater, the bearish trend is under negative pressure because the price of Polkadot (DOT) is moving up.
4. GXChain (GXC)

There were several times GXChain (GXC) broke through the EMA/200 but this did not last long because it was not followed by a trend change where a candle did not form. A candle that forms above the price of 6,000 will indicate that the correction can end and be followed by a positive trend change.
5. Ethereum Classic (ETC)

The MACD indicator will manage to show a positive change, with the break of the 320,000 – 370,000 area but the price will weaken again if the trend cannot hold above the 220,000 – 250,000 level.
NOTES:
If the EMA 5, crosses the WMA 75, 85 and EMA 200 lines, and the lines intersect from bottom to top, then the market trend is upward (bullish).
Each table above shows that if, the value of EMA 5 is higher than WMA 75, 85 and EMA 200, then the market is trending up (bullish).
If the RSI and MACD values show the same condition, it means that the market is showing the same trend, overbought (overbought), or oversold (oversold) conditions are one indicator that the market is at the point of changing the direction of the trend.
ATTENTION: All content including text, analysis, predictions, images/charts, and news contained on this website, is only used as trading information only, and not a suggestion/suggestion to trade (buy/sell) certain crypto assets. All crypto asset trading decisions are independent decisions by the user. Therefore, all risks arising from it, both profit and loss, are not the responsibility of INDODAX.[/alert


 Polkadot 10.19%
 BNB 1.03%
 Solana 4.87%
 Ethereum 2.37%
 Cardano 1.68%
 Polygon Ecosystem Token 2.03%
 Tron 2.89%
 Market


