This week, the bullish crypto lineup is led by Bitcoin(BTC) in first place, and followed by XRP(XRP) and TRON(TRX).
Want to know how your favorite crypto asset is performing? Check INDODAX Market Signal below!
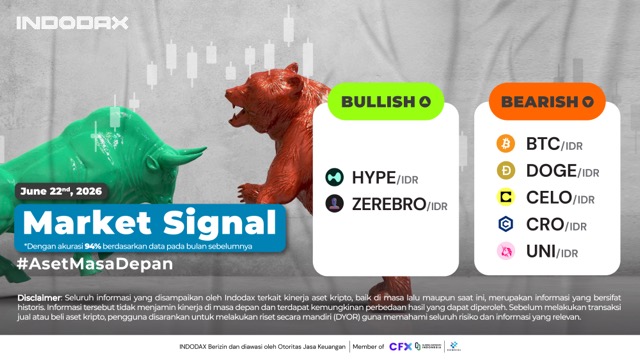
4 Bullish Crypto Assets
1.Bitcoin (BTC)

Bitcoin (BTC) assumption allows the trend to move positively with the holding of Bitcoin (BTC) above EMA/200, the latest high price of BTC allows a successful break of Resistance 1,800,000,000 – 1,900,000,000.
2.XRP (XRP)

XRP (XRP) may need more confirmation time, the current trend managed to stay positive with no candles formed below EMA/200 but XRP (XRP) is still moving below WMA/85.
3.Tron (TRX)

XRP (XRP) may need more confirmation time, the current trend managed to stay positive with no candles formed below EMA/200 but XRP (XRP) is still moving below WMA/85.
4.Sui (SUI)

The trend switch from Bullish to Bullish on Sui (SUI) is expected to occur with the Candle moving below EMA/200 then followed by the Support level in the range of 25,000 – 45,000 successfully broken.
5 Bearish Crypto Assets
1.Solana (SOL)

On the 4-hour chart used, Solana (SOL) was confirmed to be in the Bearish phase on June 06, 2025 Solana (SOL) experienced negative price changes weakening more than 5% since switching to the Bearish trend.
2.BarnBridge (BOND)

Weakness is expected to continue to occur on BarnBridge (BOND), currently the trend is moving below EMA/200 where it will test Support in the range of 2,000 – 3,000.
3.Clash of Lilliput (COL)

The weakening price of Clash of Lilliput (COL) is inseparable from moving the candle below the WMA/85 so that several supports are broken such as 5,000 – 6,000 and the 3,200 – 4,500 area.
4.Brett (BRETT)
 Having a negative response after Resistance at a fairly dominant area of 1,300 – 1,550 was not broken, Brett (BRETT) experienced a correction with a break of Support 905 – 1,100 confirming Bearish continued.
5.Livepeer (LPT)
 Having a negative response after Resistance at a fairly dominant area of 1,300 – 1,550 was not broken, Brett (BRETT) experienced a correction with a break of Support 905 – 1,100 confirming Bearish continued.
NOTE: If the 5 EMA crosses the WMA 75, 85 and 200 EMA lines and the lines intersect from the bottom up, then the market trend tends to go up (bullish), each table above shows that if the 5 EMA value is higher than the 75.85 WMA and 200 EMA, the market tends to go up (bullish).
If the RSI and MACD values ??show the same condition, it means that the market is showing the same trend. Overbought or oversold conditions are an indicator that the market is already at the point of changing direction of a trend.
ATTENTION: All contents which includes text, analysis, predictions, images in the form of graphics and charts, as well as news published on this website, is only used as trading information, and is not a recommendation or suggestion to take action in transacting either buying or selling. certain crypto assets. All crypto asset trading decisions are independent decisions by the users. Therefore, all risks arising from it, both profit and loss, are not the responsibility of Indodax.
 Market