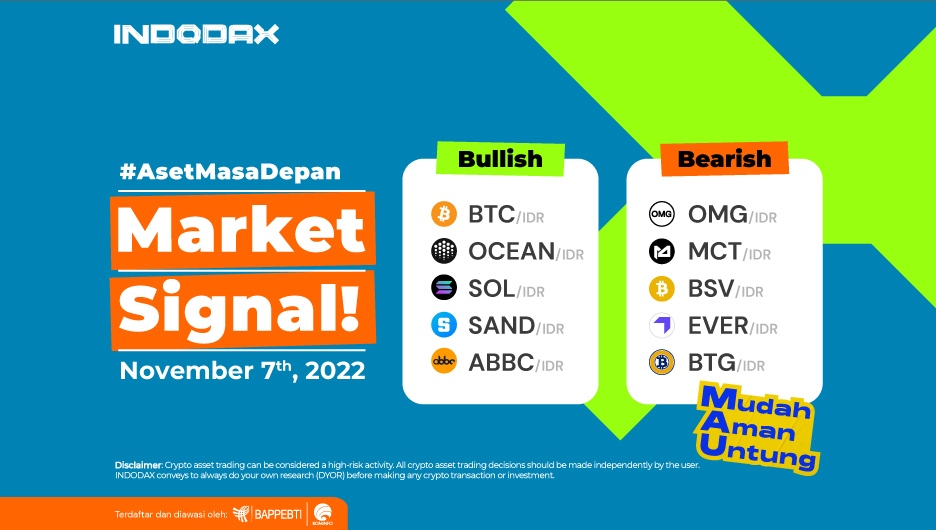
Coins that indicated Bullish in early November in the first place were occupied by BTC.
5 Bullish Crypto Assets
Bitcoin (BTC)

The strengthening in Bitcoin began with a trend that was able to move from the Sideways zone in the range of 295,000,000 – 300,000,000, then broke through the Resistance and EMA/200 levels, thus signaling BTC’s break from the Bearish phase.
Prices continue to move higher following the direction of the trend movement. BTC resistance level is available at the level of 337,000,000. If it is broken, the positive approach will be more substantial, potentially going 360,000,000 – 367,000,000.
The RSI indicator indicates that if the current trend has crossed the Overbought area, the correction will try to move to the price of 322,000,000 – 325,500,000.
Ocean Protocol (OCEAN)

Ocean Protocol has been indicated to be on the Uptrend chart since October 23, 2022, when the trend was able to form a positive Gap which was followed by a break of the 2,700 level. Indications of strengthening can still occur. It can be seen that the MACD indicator shows a positive trend with a positive histogram. The price will try to test the price range of 4.295 – 5,850. If it breaks, the indication for further strengthening will be even more excellent.
Solana (SOL)

Even though it is already in the Bullish zone, which indicates the trend is in a positive direction, SOL has weakened several times to the level of 475,000 – 492,000 but was unable to penetrate that level and resumed strengthening. Having touched the range of 60,000 but the price failed to improve, there is a Support level in the area of ??528,000 – 535,000 to test the depth of the trend weakening.
The Sandbox (SAND)

A break of the EMA/200 became a momentum for the SAND to fluctuate. Still, in a positive direction, the Bollinger Bands indicator illustrates that the two lines are far apart, indicating that The Sandbox on the 4 Hours time frame will move dynamically.
Dynamic trend movements will create a vast opportunity to penetrate the Resistance and Support levels. SAND has a resistance level of 16,150 while the support level is at 13,150 – 13,600.
ABC Coin (ABBC)

The increase in ABBC Coin on the 1-Day chart cannot be separated from the trend that was able to cross upwards in the Sideways zone with a movement range of 2,160 – 2,670. The trend continues to strengthen and break through the 2,965 level and stay above the 3,200 level.
Strengthening will continue if ABBC can pass the price of 4,500 and is followed by a complete candle that is formed.
Meanwhile, contrary to the forecast, ABBC Coin’s Bullish trend will be depressed if the Candle experiences a significant weakening which causes the trend to be unable to hold above the EMA/200 and break the Support level at 1,700.
5 Bearish Crypto Assets
OMG Network (OMG)

The 1-day chart shows that OMG has been in a bearish trend since January 02, 2022. The bearish phase will be depressed if OMG has a dominating buying level, so it will push the price up and have to break through several resistance levels, such as the 31,700 – 41,300 area.
The weakening will occur if the trend returns below WMA/75 and WMA/85, with the nearest support level at 24,000.
Metacraft (MCT)

The inability of the trend to strengthen and penetrate WMA/75 further made MCT slump in the Bearish zone. Using the Bollinger Bands indicator illustrates the Metacraft trend on the 4 Hours time frame being in the Sideways Downtrend phase, with a price range of 9,000 – 10,000, a break of one level will provide momentum for MCT prices, both positive and negative impacts.
Bitcoin SV (BSV)

The MACD indicator illustrates that both lines are narrowing which indicates that the price is in the Sideways Downtrend zone, with the level of price change expected to be in the range of 685,000 – 842,000.
The Bearish phase will fail to continue if the trend is able to strengthen through the 980,000 level, a break of this level will make improvements to the Bearish trend.
Everscale (EVER)

It had experienced a strengthening through the 875 level, but the EMA/200 line stopped the price. At the 905 level, the price bounced back and continued to weaken. If the trend can break above WMA/75 and WMA/85, it will increase the opportunity for EVER to get past the EMA/200.
Weak prices will try to stay above the 800 – 820 level. If the support level is broken, it will be expected that EVER will touch the lowest price during trading on Indodax.
Bitcoin Gold (BTG)

When estimating the direction of BTG with the MACD indicator, it can be seen that currently, the price tends to move sideways, which tends to weaken, which occurred in the Bearish phase with a price range of 240,000 – 350,000.
Advanced Resistance levels are ??370,000 – 420,000, while Support levels are 210,000 to 222,000.
NOTE: If the EMA 5 crosses the WMA 75, 85, and 200 EMA lines and the lines intersect from the bottom up, then the market trend tends to be bullish (bullish),
each table above shows that if the value of EMA 5 is higher than WMA 75.85 and EMA 200, the market tends to go up (bullish).
If the RSI and MACD values ??show the same condition, the market is showing the same trend. Overbought (overbought) or oversold (oversold) conditions indicate that the market is already at the point of changing the trend direction.
Attention: All content which includes text, analysis, predictions, images in the form of graphics and charts, as well as news published on this website, is only used as trading information and is not a recommendation or suggestion to take action in a transaction, either buying or selling. Certain crypto assets. All crypto asset trading decisions are independent decisions by the user. Therefore, all risks arising from it, both profit and loss, are not the responsibility of Indodax.


