In markets such as stocks, forex, crypto, and others, technical (technical) analysis using complete chart patterns is very important.
Using historical data and price charts, technical analysis is important in helping traders and investors make better trading and investment decisions.
One of the important technical analysis tools to help traders and investors is chart patterns.
This chart pattern will allow traders and investors to see potential future price movements based on patterns that existed in the past.
So, to better understand chart patterns, from the meaning, types, and benefits to how to recognize the pattern, see the following review.
Know What a Chart Pattern is
Chart patterns are graphic patterns related to price fluctuations repeatedly and provide key signals, namely trend continuation, and reversal.
As mentioned earlier, this pattern is often used in stock trading, forex, and other instruments as a basis for technical analysis.
In this case, the chart pattern will be identified by a line that brings together several price points over a certain period, including closing prices, highs, and lows.
Of course, chart patterns in technical analysis on markets such as stocks, forex, crypto, and others have an important function.
As mentioned earlier, a trader or investor will be able to predict the next price direction much better by studying these patterns.
Also, for technical analysis, chart patterns for traders will be very helpful in determining profit and cut-loss targets because these patterns allow them to read market prices.
For your information, chart patterns apply to various financial instruments because the underlying principle is the same: the behavior of the masses in the market.
Therefore, although these financial instruments have different characteristics, certain patterns on the price chart can still be formed.
In the end, it will also provide clues about the direction of price movement in the future.
Types of Complete Chart Patterns That Must Be Known

After knowing the definition, you must also know the complete types of chart patterns.
This understanding is important because each pattern has different characteristics and implications for future price movements.
With this understanding, traders and investors can later take advantage of these types of patterns before making measured trading decisions.
The following are complete chart pattern types that you must know, including:
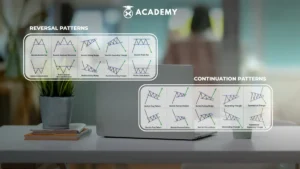
Continuation Pattern
A continuation pattern or continuation pattern is a type of chart pattern showing symptoms of continuing asset prices in the capital market from the previous trend.
The form of this continuation pattern is very good for identifying signals regarding temporary price corrections.
On this type of chart, the asset price will return to normal after a temporary correction after this pattern has been formed.
Some of the patterns included in the continuation pattern type are as follows, namely:
- Flag Pattern
This flag pattern is called the flag pattern because its shape resembles a flag. The function of the flag pattern is to find out the price area for a breakout when it breaks the resistance/support area.
- Pennant Pattern
Next, there is a pennant pattern that resembles a diagonal triangle. This pattern is formed after an uptrend slows downwards while a lower trend tends upwards.
- Wedge Pattern
The next pattern is a wedge pattern, almost the same as the pennant pattern, namely the wedge pattern. Related to that, the line structure is almost similar to the pennant pattern.
- Rectangle Pattern
The rectangle pattern will resemble a rectangle if it is outlined. However, in practice, this pattern is only sometimes horizontal because it can be slightly tilted as if forming an angle.
Reversal Pattern
A reversal pattern is a pattern that is present as a signal that describes a trend reversal.
This type of chart pattern in this pattern will usually appear at the top (top) of the price or the bottom (bottom).
This pattern will identify that the price trend can no longer strengthen or decrease so that when the pattern is created, the price will reverse to form a new trend.
The patterns that fall into the reversal pattern category include the following:
- Double Top and Double Bottom Pattern
In the double-top pattern, the signal will appear when the two peaks (double top of the highest price) of the triangle pattern formed from a trend are at the same level.
Meanwhile, the double bottom pattern itself is the opposite of the double top pattern.
- Triple Bottom
Almost similar to the double top and double bottom patterns, then there is the triple bottom pattern.
However, the difference appears in the number of triangle patterns created, which are more reliable as a more tested reversal confirmation power.
- Head and Shoulder Pattern
Another reversal pattern is the Head and Shoulder Pattern. The triangle pattern is present after the trend is formed, making the first highest price become shoulder 1.
Furthermore, the second highest price will represent the head (head) because it exceeds the first highest price (shoulder one).
Then, the third highest price will create the second shoulder (shoulder 2), then the lowest price drawn between the shoulder and the head is called the neckline.
Bilateral Chart Pattern
A bilateral chart pattern is the next chart type, which is more difficult to read than the previous chart types.
The reason is price signals of this type can move in both directions, so this chart pattern is called “bilateral.”
Below are the patterns included in the bilateral chart pattern, including:
- Symmetrical pattern
A symmetrical pattern is a price pattern that illustrates the trend direction, and price momentum have similarities.
This pattern shows that price increases and decreases have the same balance, so price movements look balanced.
In trading, symmetrical patterns assist traders in determining entry and exit points.
This pattern will usually form a channel showing support and resistance boundaries, so traders can enter into buy positions in the support area and sell positions in the resistance area.
- Ascending Triangle
The form of the chart pattern in this trading will show the ongoing price consolidation.
The ascending triangle will show that the price is trying to melt the existing resistance and continue the upward trend.
This chart in trading is often considered a buy signal because it shows that the price is building momentum to increase.
Usually, a break out of this pattern will follow the ongoing trend and has the potential to provide benefits for traders.
- Descending triangle
The next chart pattern form is the Descending Triangle. This pattern shows the price is trying to melt the existing support and continue the downward trend.
The descending triangle is often seen as a sell signal in trading because it shows that the price is trying to build momentum on moving downwards.
Benefits of Understanding Chart Patterns
It is very important to understand chart patterns in technical analysis for traders and investors.
The reason is that with an understanding of various chart patterns, later traders can predict prices to achieve maximum profit.
Chart patterns have many benefits for traders, ultimately guiding them in making trading decisions.
Following are some of the benefits of understanding chart patterns that are important to know, including:
1. Predicting the Direction of the Price Movement
Traders will certainly be helped to predict the direction of price movements if they recognize the various chart patterns.
This does not only apply to current price movements but also future prices.
2. Finding Potential Entry and Exit Points
Traders will also find determining potential entry and exit points easier when they understand chart patterns.
The reason is that entering and leaving the market must be done promptly.
3. Strengthening Technical Analysis
Chart patterns can be used to strengthen the technical analysis being used.
This is because chart patterns are indeed a part of trading in strengthening the analysis carried out.
4. Manage Risk Better
Traders can manage trading risks better when they understand chart patterns.
This is because chart patterns can also determine the most measurable stop-loss level.
5. Get Better Profits
Traders can also get better profits by using chart patterns.
This can happen when all the predictions and stop losses found by the trader are accurate so that he can determine the most potential target profit level.
6. Identify Emerging Trends
Besides that, chart patterns certainly also allow traders to identify trends that are developing in the market.
7. Strengthening Fundamental Analysis
Understanding chart patterns will also help strengthen fundamental analysis for a trader.
Later, traders will also get more accurate predictions after combining all the analysis results. Both technical and fundamental, with a variety of existing patterns.
How to Recognize Patterns in Charts

After knowing the benefits of understanding chart patterns, it is also important to find out how to recognize patterns on charts.
In technical analysis, understanding how to recognize chart patterns is an important skill.
Of course, with a good understanding of this, later traders can improve their ability to make more measurable trading decisions.
The following are steps that can be taken to identify chart patterns, including:
1. Determine the relevant timeframe
First, traders can choose and determine the relevant timeframe to identify chart patterns in conducting their analysis.
This timeframe can be daily or weekly, depending on each trader’s goals and trading style.
2. Draw trend lines, support, and resistance levels
The next step is to draw trend lines, support (lower limit), and resistance (upper limit) levels.
The trick is to draw horizontal lines at points on price positions that are difficult to break through.
3. Using appropriate technical indicators
As a final step, traders can use appropriate technical indicators to confirm chart patterns.
Take, for example, traders can use oscillator indicators such as the Relative Strength Index (RSI) or momentum indicators such as the Moving Average Convergence Divergence (MACD) if they want to find out whether there is a divergence/confirmation of the pattern that is created.
Conclusion
In conclusion, chart patterns are an important technical analysis tool to help traders and investors make trading decisions.
The reason is this pattern allows traders and investors to see potential future price movements based on patterns that existed in the past.
It also needs to be underlined that a holistic approach is important in trading (trading).
This approach refers to a comprehensive market understanding and considers various interrelated factors.
Related to this, chart patterns can be a tool in a holistic approach to achieving trading success.


