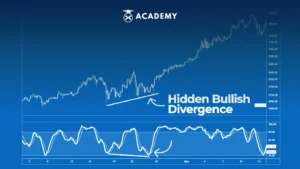
In financial market trading, especially stocks, forex, and crypto, one of the patterns of technical analysis often used is the hidden bullish divergence.
A hidden bullish divergence occurs when the price of an asset is making higher lows, but at the same time, the momentum indicator is making even lower lows.
Hidden bullish divergence is a positive signal for traders because it indicates that price strength might be building even though the trend generally shows higher lows.
Technical analysis has a very important role in crypto trading. The reason is technical analysis will help traders to understand the price patterns of crypto assets, identify trends, and determine support and resistance levels.
So, to better understand what hidden bullish divergence is, tips on identifying it, and how to trade using this one signal, see the following review.
What is Hidden Bullish Divergence?

In crypto technical analysis, hidden bullish divergence is a pattern or concept that occurs when the price of a crypto asset forms higher lows, but at the same time, the momentum indicator forms even lower lows.
This one pattern suggests that even if the price is making higher lows, the weakness in momentum is diminishing, and there is potential for further price strength.
As for crypto trading, hidden bullish divergence is important because it can provide a potential signal about a trend reversal or price strengthening amid an ongoing downtrend. This pattern is also useful for confirming entry and exit signals in trading.
Furthermore, by knowing the hidden bullish divergence, traders can place more appropriate stop-loss levels and manage risk better. On the other hand, this pattern will also help traders to recognize potential reversals or pullbacks in an uptrend.
What is Hidden Bearish Divergence?
Apart from hidden bullish divergence, in crypto analysis, there is also hidden bearish divergence, which is a pattern or concept that occurs when the price of a crypto asset forms a lower high (high), but at the same time, the momentum indicator forms a higher high position.
This one pattern suggests that even if the price is posting lower highs, gains in momentum are increasing, and there is potential for further price declines.
Hidden bullish divergence is important in crypto trading because this pattern provides a potential signal about a trend reversal or price decline amid an ongoing uptrend.
In addition, a hidden bearish divergence is also used in conjunction with other technical analyses to provide further confirmation in making entry or exit decisions from the market.
Furthermore, hidden bearish divergence will also help traders to recognize potential reversals or pullbacks in a downtrend.
Get to know Hidden Bullish and Hidden Bearish Divergence Indicators.
The hidden bullish divergence and hidden bearish divergence indicators are patterns in the technical analysis used to identify potential changes in price trends in crypto trading.
The hidden bullish divergence occurs when the price of a crypto asset forms a higher low, but at the same time, the momentum indicator forms a lower low.
The hidden bullish divergence pattern illustrates that even if prices make higher lows, the weakness in momentum is reduced, and there is potential for further price strength.
To identify hidden bullish divergence on crypto charts, the steps that can be taken are as follows, namely:
- Look for two consecutive lows in the price
- Next, simultaneously, pay attention to the two lows on the momentum indicator (e.g., RSI or MACD)
- If the price forms a higher low, but the momentum indicator forms a lower low, it is a hidden bullish divergence signal.
Please note hidden bullish divergence and hidden bearish divergence have the following differences:
- A hidden bullish divergence occurs during an uptrend, indicating that price strength may continue after a retracement. This signal indicates the potential to buy (buy) or get out of a short position (exit short).
- A hidden bearish divergence occurs during a downtrend, indicating that the price decline may continue after a retracement.
- This signal indicates a potential sell (sell) or exit from a buy position (exit long).
Farther, when t traders identify hidden bullish divergence or hidden bearish divergence patterns on crypto charts, they will provide potential signals about the reversal or continuation of price trends. This indicator helps traders with the following things, namely:
- Identify the right moment to enter or exit the market, depending on the expected trend direction.
- Know when a price trend might change or experience a temporary retracement so they can take appropriate steps.
- Setting stop-loss levels and profit targets based on anticipated price movements will assist in management and minimize risk.
Tips for Identifying Hidden Bearish Divergence

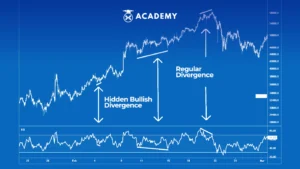
Regarding tips on identifying hidden bearish divergence, it is important to note that two types of divergence can be found on the price chart of crypto assets: regular divergence and hidden divergence. The following is an explanation of the two types, namely:
1. Regular Divergence
Regular divergence consists of 2 types of divergence: regular bullish divergence and regular bearish divergence. Both have an important role in showing price reversal.
The regular bullish divergence occurs when the actual price of a crypto asset shows the lowest low position when compared to the highest low position depicted by the indicator.
2. Hidden Divergence
It is known that hidden divergence is also divided into two types: hidden bullish divergence and bearish divergence. The hidden divergence is the opposite of the regular divergence, showing that the downward retracement is over, and the trend is likely to continue.
A hidden bullish divergence occurs when the current stock price shows higher lows than lower lows on the indicator. Bullish divergence indicates an upcoming trend or retraces a downtrend.
How to Trade Using Hidden Bearish Divergence Signals
Several important steps must be considered when you want to use hidden bearish divergence signals in crypto trading. These steps will help identify a potential trend reversal or strengthening of the downside.
The following is a way to trade using hidden bearish divergence signals that you need to know, including:
1. Learn all the terms and patterns involved
First, it is important for traders to continue learning all the terms and patterns on the charts in crypto trading. Traders must also routinely and diligently monitor market conditions to analyze trends further.
2. Have the right calculation
Furthermore, traders need to have the right calculations at the right time. The reason is, rushing into action is often one of the biggest failures of a trader.
There will indeed be times when traders need to take big steps, even if they have to take risks, but even that should only be done when traders have made the right calculations.
3. Know the stop loss
Next, the trader must also know the stop loss. This is because the value of an asset may continue to decrease over time. So, when that happens, traders need to know exactly when the lower limit value of an asset is to place a stop loss immediately.
4. Setting reasonable profit targets
Finally, on this list, traders need to set reasonable profit targets. Therefore, keep in mind again that greed will only bring traders losses.
Conclusion
In conclusion, divergence is a concept in technical analysis that refers to the difference between the price movement of an asset and a particular technical indicator, for example, the RSI or MACD indicator.
In crypto trading, divergence plays an important role in helping traders identify potential changes in price trends in the crypto market, enabling them to make better trading decisions.
In addition, traders can use divergences as additional signals to validate technical analysis and increase the accuracy of price predictions. Furthermore, divergences also provide information about trend strength and market momentum, assist in risk management, and set stop-loss levels for traders.
It is also important to underline that crypto trading involves high risks, so traders should always use good risk management. Besides that, traders must also increase their awareness and constantly learn to improve.
In this case, study different trading strategies, evaluate trading results, and always correct mistakes that may be made in trading. Remember again becoming a successful trader takes time, patience, and a lot of dedication.
That was the discussion about the Hidden Magic of Bullish Divergence, starting with understanding, tips, and how to use it. You can also read a collection of articles at INDODAX Academy.
Unraveling the Hidden Magic of Bullish Divergence
So, now you understand what hidden bullish divergence is, tips on identifying it, and how to trade using this one signal.
Next, you can invest in the best crypto trading application, INDODAX. By downloading the INDODAX application, you will get the best investment and crypto trading features from your smartphone.
One of the interesting features that you can try on INDODAX is INDODAX Earn or staking crypto. This feature lets you lock up your crypto assets, like saving funds in a savings account.
Later, the crypto assets locked in INDODAX Earn will provide rewards like savings interest. The INDODAX Earn staking crypto feature can also be accessed anytime and anywhere via the Mobile App or the desktop on the INDODAX website, namely on the INDODAX Earn staking crypto page.


