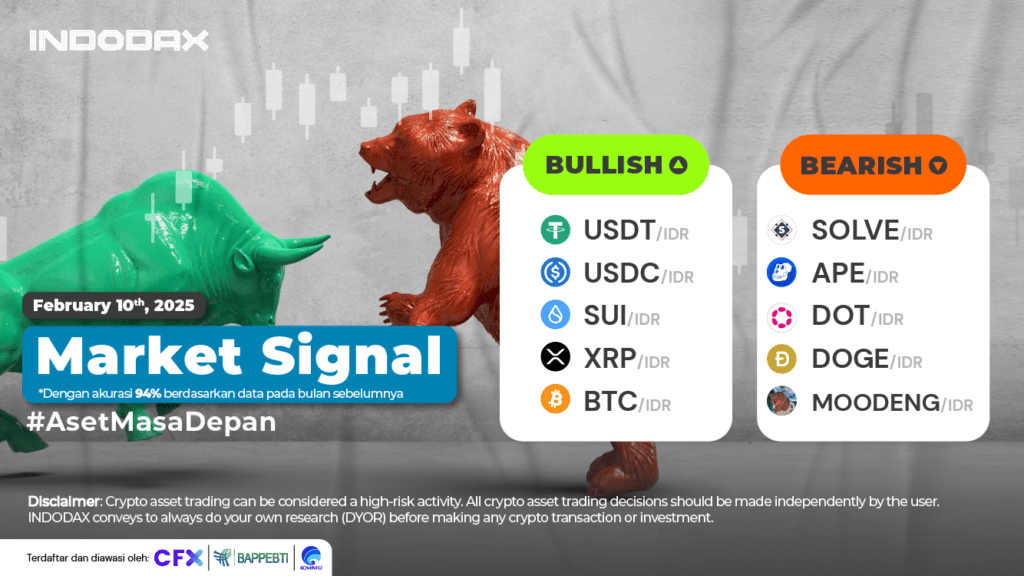
This week, the bullish crypto lineup is led by USDT (USDT) in first place, followed by USDC(USDC) and SUI (SUI)
Want to know how your favorite crypto asset is performing? Check INDODAX Market Signal below!
5 Bullish Crypto Assets
1. USDT (USDT)

USDT (USDT) can stay above EMA/200 ensuring USDT (USDT) is still in the Bullish phase, with Support level in the range of 15,750 – 16,120 area, the MACD indicator will ensure trend movement with Support being a crucial area.
2.USDC (USDC) 
The trend is held back by the MACD indicator, it takes more time to confirm the direction of the next price movement, Resistance is indicated at the level of 16,350 – 16,700, positive momentum will drive the price.
3.Sui (SUI)

Not yet successful in making Candle above the price of 90,000 Sui (SUI) experienced a weakening of more than 30% MACD indicator shows a negative trend direction, price improvements will be formed with Candle that can be formed above the area of ??60,000 – 70,000.
4.XRP (XRP)

After touching its highest price, XRP (XRP) experienced a correction in the RSI indicator, showing that the trend was already in the Overbought area, the weakening that occurred could penetrate the WMA/85 with the next Support of 22,000 – 33,000.
5.Bitcoin (BTC)

In terms of trend movement on the 1 Day time frame, Bitcoin (BTC) has a positive movement that is still successfully holding above the EMA/200 with the closest Support in the price range of 1,300,000,000 – 1,500,000,000. This range is passed by the EMA/200 which will test the next trend.
5.Aset Kripto Bearish
1.Solve (SOLVE)

Solve (SOLVE) has been indicated to be in a Bearish phase since May 19, 2024, negatively impacting the price weakening with Solve (SOLVE) weakening by more than 75%. The opportunity for the trend to be corrected is open, the line on the MACD indicator cuts upwards Resistance is in the range of 80 – 120.
2.ApeCoin (APE)

The trend that failed to move above the EMA/200 was able to drive negative changes in the price of ApeCoin (APE), the weakening is expected to deepen with the penetration of Support 8,000 – 10,000.
3.Polkadot (DOT)

The penetration of the Support level of 64,000 – 75,000 has a negative impact on the change in the Polkadot (DOT) trend, it is estimated that Bearish will increasingly dominate the previous trend change with the MACD indicator crossing downwards.
4.Dogecoin (DOGE)

Being able to stay above EMA/200 creates an opportunity to continue the Bullish phase but Resistance 6,500 – 7,100 was not successfully penetrated, the price weakened quite deeply by more than 20% ensuring the Downtrend zone to form.
5.Moo Deng (MOODENG)
 Moo Deng (MOODENG) ??is still experiencing negative pressure, the trend has not moved from WMA/85, a positive movement will be formed with a trend that is able to penetrate the 1,400 – 2,800 area, the Bollinger Bands indicator will show fluctuating price changes.
NOTE: If EMA 5, crosses the WMA 75, 85 and EMA 200 lines and the lines intersect from bottom to top, then the market trend tends to rise (bullish),
in each table above shows if the EMA 5 value is higher than WMA 75.85 and EMA 200 then the market tends to rise (bullish).
If the RSI and MACD values ??show the same condition, it means that the market is showing the same trend, overbought or oversold conditions, are one indicator that the market is at the point of changing the trend direction.
ATTENTION: All content that includes text, analysis, predictions, images in the form of graphics or charts, and news contained on this website, are only used as trading information, and are not recommendations or suggestions to take action in transactions, either buying or selling certain crypto assets. All crypto asset trading decisions are independent decisions by the user. Therefore, all risks arising from it, both profit and loss, are not the responsibility of Indodax.


 Polkadot 8.91%
 BNB 0.54%
 Solana 4.81%
 Ethereum 2.37%
 Cardano 1.35%
 Polygon Ecosystem Token 2.11%
 Tron 2.85%
 Market


