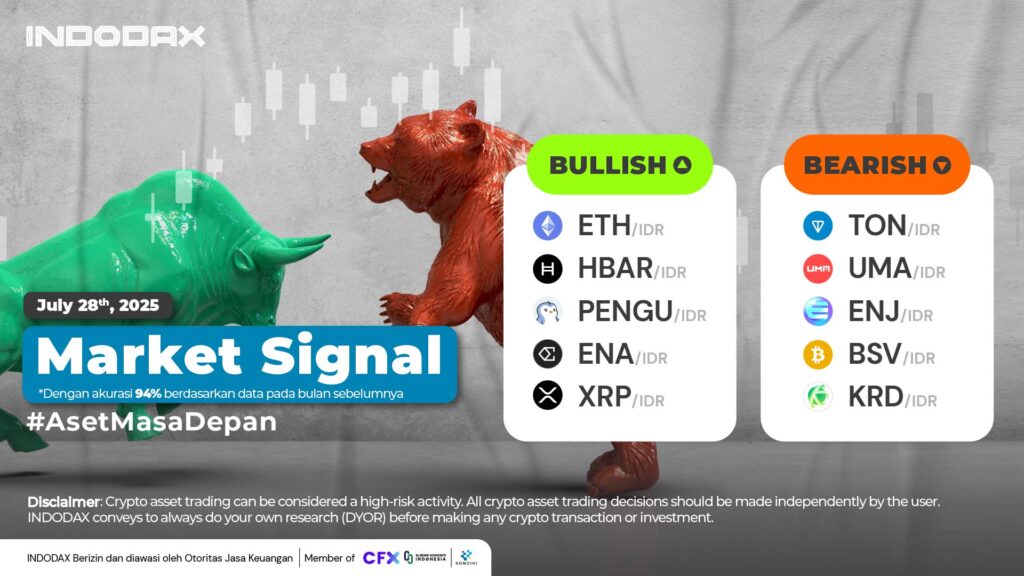
This week, the bullish crypto lineup is led by Ethereum(ETH) in first place, followed by Hedera (HBAR) and Pudgy Penguins (PENGU) .
Want to know how your favorite crypto asset is performing? Check INDODAX Market Signal below!
5 Aset Kripto Bullish
1.Ethereum (ETH)

The price change of Ethereum (ETH) is estimated to be quite high, with the line indicated by the Bollinger Bands indicator, being penetrated by a fairly large Resistance area with a price range of 65,000,000 – 70,000,000. If it succeeds in passing this area, it will make Ethereum (ETH) touch its highest price.
2.Hedera (HBAR)

Hedera (HBAR) has a wide potential to strengthen, the trend is indicated by the MACD indicator being in a positive direction with the two available lines moving apart, resistance is available in the range of 5,000 – 5,900.
3.Pudgy Penguins (PENGU)

Pudgy Penguins (PENGU) has a strong Bullish trend, with the price of Pudgy Penguins (PENGU) continuing to break through Resistance and forming new highs even though the price was indicated to be in the Overbought area on the RSI indicator, Pudgy Penguins (PENGU) is still continuing to strengthen.
4.Ethena (ENA)

On the 4-hour time frame, Ethena (ENA) has been in a bullish phase since July 16, 2025, and the trend has slowly begun to strengthen positively above the WMA/85 resistance level, such as 6,800 – 7,800.
5.XRP (XRP)
 The weakening that occurred in XRP (XRP) allows the trend to test the Support area of 45,000 – 50,000 WMA/75 will experience negative pressure confirming the MACD indicator is moving in the same direction.
5 Aset Kripto Bearish
1.Toncoin (TON)

The weakening trend will likely be corrected if Toncoin (TON) moves back to the 60,000 – 80,000 area so it can test the EMA/200.
2.Uma (UMA)

The Bearish trend will fail to continue with the Candle remaining above the 30,000 – 40,000 area. This will allow Uma (UMA) to move beyond the EMA/200.
3.Enjin Coin (ENJ)

The price is still moving in a Sideways trend, making Enjin Coin (ENJ) not experience significant changes with a movement range of 1,200 – 1,900. A breakout of one of these areas will confirm the direction of Enjin Coin (ENJ)’s next movement.
4.Bitcoin SV (BSV)

Although the price of Bitcoin SV (BSV) had broken through the EMA/200, it did not last long, with Bitcoin SV (BSV) unable to form a Candle causing Bitcoin SV (BSV) to experience a correction again and move into a Bearish phase.
5.Krypton DAO (KRD)

A bearish trend has been evident in Krypton DAO (KRD) since January 25, 2025, with the price of Krypton DAO (KRD) already experiencing a significant decline of over 50%. This price decline could be reversed by breaking through the 400-550 area.
NOTE: If the 5 EMA crosses the WMA 75, 85 and 200 EMA lines and the lines intersect from the bottom up, then the market trend tends to go up (bullish), each table above shows that if the 5 EMA value is higher than the 75.85 WMA and 200 EMA, the market tends to go up (bullish).
If the RSI and MACD values ??show the same condition, it means that the market is showing the same trend. Overbought or oversold conditions are an indicator that the market is already at the point of changing direction of a trend.
ATTENTION: All contents which includes text, analysis, predictions, images in the form of graphics and charts, as well as news published on this website, is only used as trading information, and is not a recommendation or suggestion to take action in transacting either buying or selling. certain crypto assets. All crypto asset trading decisions are independent decisions by the users. Therefore, all risks arising from it, both profit and loss, are not the responsibility of Indodax.
 Market