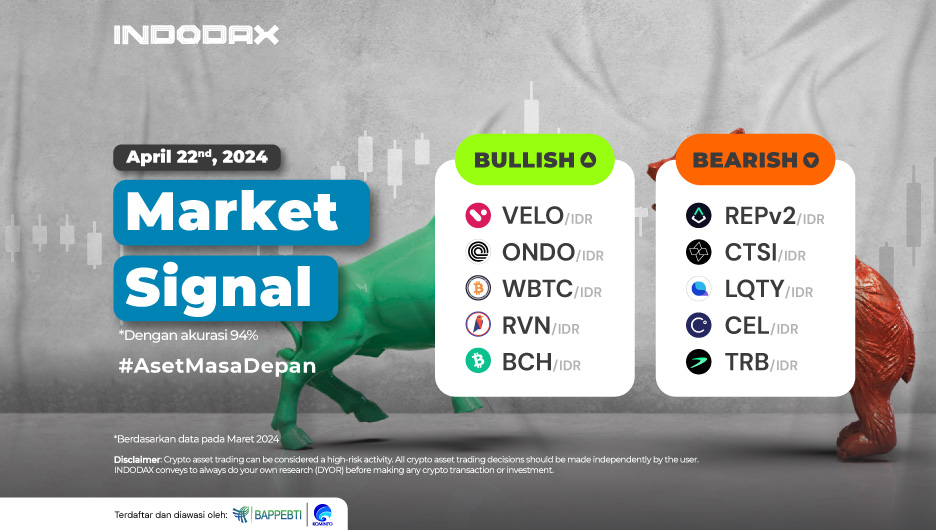
VELO (VELO) and Ondo (ONDO) are at the top of this week’s bullish trend.
Curious about which crypto assets are experiencing bullish or bearish trends this week? Come on, check out the complete INDODAX Market Signal update below!
5 Bullish Crypto Assets
1. VELO (VELO)

The movement of the VELO (VELO) trend in the bullish phase positively impacts price changes and resistance levels that can be penetrated, such as the dominating resistance area at the 200-230 level, thus encouraging prices to continue to rise. Indications of dynamic strengthening and changes in the price of VELO (VELO) are quite wide open, but so are the opportunities for it to weaken, where the 190-240 level is the decisive level for VELO (VELO) in the event of a price decline.
2. Ondo (ONDO)

Ondo (ONDO) can stay above the EMA/200 line even though the price has moved several times below this line, but the price can strengthen again, and the candle does not form. The movement of the Ondo (ONDO) trend will lead to a break from the resistance area of 15,300-16,800. This area is predicted to be broken, and the bullish trend will become stronger.
3. Wrapped Bitcoin (WBTC)

Weakness in Wrapped Bitcoin (WBTC) had no impact until the candle moved below WMA/85, but the support area was tested to be 950,000,000-1,000,000,000. If this area cannot withstand the weakening, it will allow Wrapped Bitcoin (WBTC) to penetrate WMA/85.
4. Ravencoin (RVN)

It touched the 980 level, making Ravencoin (RVN) match its highest price since September 13, 2022. Strengthening Ravencoin (RVN) will be created if the candle can stay above the 1,000-1,100 area.
5. Bitcoin Cash (BCH)
 Bitcoin Cash (BCH) price experienced weakness in line with the MACD indicator, which has shown a negative crossover but, in the current trend, managed to stay above WMA/75. The weakening of Bitcoin Cash (BCH) will test the strength of the support level of 7,000,000-7,500,000, and breaking through this area will increase the indication that Bitcoin Cash (BCH) is experiencing a correction.
5 Bearish Crypto Assets
1. Augur v2 (REPv2)

Support is in the 6,400-8,000 area, which is important for Augur v2 (REPv2). If this direction is broken, the weakening of Augur v2 (REPv2) is expected to deepen, and the bearish trend will become strong enough to continue.
2. Cartesi (CTSI)

Resistance 6,800-7,200 is a strong level for Cartesi (CTSI). Failure to pass this level made the Cartesi (CTSI) trend bearish. The bearish trend will experience pressure if the candle can pass 4,500-6,000.
3. Liquity (LQTY)

The weakening price that occurs due to the ongoing bearish trend will be able to improve the price because the MACD indicator estimates that Liquity (LQTY) is on a positive path, with the price aiming at 18,000-20,000.
4. Celsius (CEL)

The price of 3,300-4,000, which was penetrated negatively, was one of the reasons Celsius (CEL) changed its trend from bullish to bearish. If the candle can penetrate the 3,000-3,200 level, it will cause the upper line of the Bollinger Bands to be broken, which is expected if the price of Celsius (CEL) becomes volatile.
5. Tellor (TRB)

Tellor (TRB) is still in the sideways zone with a movement range of 740,000-1,050,000. A new Tellor (TRB) trend movement will be created and confirm the next price direction, if one of the levels can be penetrated and a candle is formed.
NOTES:
If EMA 5 crosses the WMA 75, 85, and EMA 200 lines, and these lines intersect from bottom to top, then the market trend tends to be upward (bullish).
Each table above shows that when the value of EMA 5 is higher than WMA 75,85 and EMA 200, the market tends to rise (bullish).
If the RSI and MACD values show the same condition, the market is showing the same trend; an overbought (overbought) or oversold (oversold) condition indicates that the market is at the point of changing trend direction.


