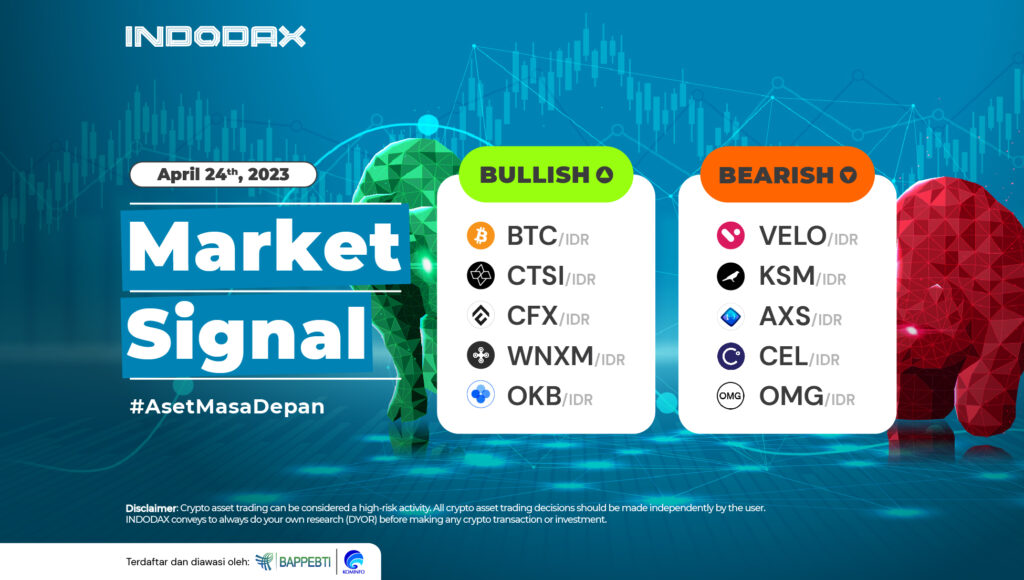
Hello INDODAX members! Arriving in the last week of April 2023. This time Bitcoin occupies the top position of the bullish trend. Let’s take a look at INDODAX Market Signals to find out which crypto assets are indicated to be bullish and bearish this week.
5 Bullish Crypto Assets
1. Bitcoins (BTC)

The bullish zone is confirmed after the trend can experience a pullback from the Support zone 305,000,000 – 320,000,000 so that the Candle moves above the EMA/200.
If BTC manages to pass the 445,000,000 – 470,000,000, the direction of the new trend in the Bullish zone will get stronger.
2. Cartesian (CTSI)

The MACD indicator indicates that if CTSi is in the positive zone, further strength on Cartesi will try to break the resistance level 5,190 – 6,000.
3. Conflux (CFX)

Being in the Bullish zone has made the strengthening in CFX even more massive, around 300%, since it was confirmed in the Bullish zone on 19 February 2023.
The decline in the trend will try to test the strength of WMA/85. If it is passed, there will be potential to test the 3.230 – 4.000 area.
4. Wrapped NXM (WNXM)

On the 1-day time frame, the RSI indicator indicates that the trend was once in the Overbought area but has moved away.
The bullish trend will form a new resistance level if WNXM can form a candle above the 500,000 price range.
5. OKB (OKB)

If you look at the chart, the price briefly touched the 860,000 price range but again weakened.
This indicates that if the resistance level at 850,000 is exceeded, OKB’s potential to form an ATH (All Time High) will be wide open.
5 Bearish Crypto Assets
1. VELO (VELO)

Even though it strengthened until it could pass EMA/200, VELO failed to continue supporting it because it was not accompanied by fairly strong resistance in the 255 – 340.
2. Kusama (KSM)

If you look at the current Bollinger Bands indicator, KSM is in a quite sideways zone in a bearish trend assuming price movements are in the 448,000 – 620,000.
3. Axie Infinity (AXS)

AXS will successfully correct the trend in the Bearish zone if it stays above WMA/75, which will then indicate a level of 160,000 – 175,000.
4. Celsius (CEL)

CEL has been in the Downtrend zone since 11 February 2022, and the decline deepened after being unable to hold above the EMA/200.
The trend will be able to strengthen again if it can pass through the 5,000 – 5,150 area first.
5. OMG Network (OMG)

The decline that occurs at OMG will try to test the support level around 17,900.
The next level is available in the 15,100 – 15,500 area if this can be passed. A break in this area will make OMG’s weakness even deeper.
Note: If the EMA 5 crosses the WMA 75, 85, and EMA 200 lines and these lines intersect from the bottom up, the market trend tends to be up (bullish). Each table above shows if the EMA 5 value is higher than WMA 75, 85, and EMA 200, the market tends to rise (bullish).
Suppose the RSI and MACD values show the same condition. In that case, it means that the market is showing the same trend, and the condition is overbought (overbought) or oversold (oversold), which is an indicator that the market is at the point of changing the direction of the trend.
Attention: All content which includes text, analysis, predictions, images in the form of graphics or charts, as well as news published on this website, is only used as trading information and is not a suggestion or suggestion to take action in a transaction, either buying or selling certain crypto assets.
All crypto asset trading decisions are independent decisions by users. Therefore, all risks arising from it, both profit and loss, are not the responsibility of INDODAX.
 Market

