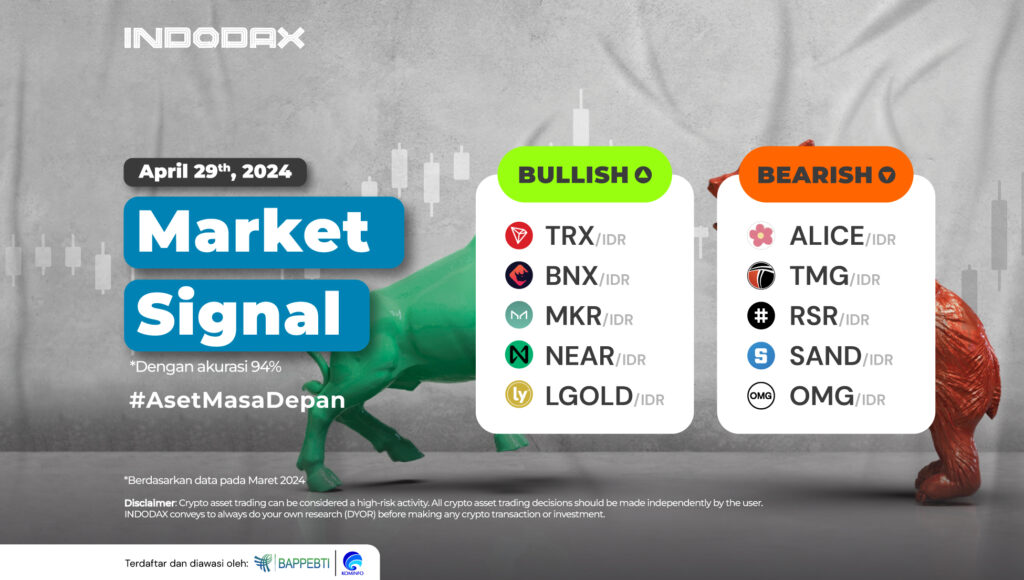
This week, Tron (TRX) and BinaryX (BNX) are leading the way in bullish-trending crypto assets.
Curious about what crypto assets are experiencing bullish or bearish trends this week? Check out the full INDODAX Market Signal update below!
5 Bullish Crypto Assets
1. Tron (TRX)

Had weakened to exceed the EMA/200, but the price of Tron (TRX) could return to strength. The 2,000 level that cannot be passed is one indication for Tron (TRX) if there is a possibility of price weakness. The support level is available in the price range of 1,500-1,800, one of the decisive levels for Tron (TRX).
2. BinaryX (BNX)

Moving sideways in the range of 310,000-540,000 ended positively. BinaryX (BNX) touched its lowest price, but after that, the price rebounded, so the bearish trend turned bullish. The price is currently in the overbought area on the RSI indicator, indicating that the candle has not been able to form above the 1,800,000-2,000,000 area.
3. Maker (MKR)

Tren Maker (MKR) is still indicated to be in a negative area. The line has not managed to cut upwards on the MACD indicator, but this will be reversed to positive if the candle can form above the price of 52,000,000.
4. NEAR Protocol (NEAR)
 The NEAR Protocol (NEAR) chart used at 1 Day time illustrates that the bullish trend is very dominant in NEAR Protocol (NEAR) price changes. The break of the 140,000 level, followed by the candle formed, will strengthen the uptrend phase and dominate.
5. Lyfe Gold (LGOLD)

Lyfe Gold (LGOLD) shows that the price is changing in a positive direction, where the trend is moving above the WMA/75, which is driving the price change. The positive trend will come under negative pressure if the available support level at 900,000 is broken, which will also allow the WMA/85 to be broken.
5 Bearish Crypto Assets
1. My Neighbor Alice (ALICE)

Price weakness for My Neighbor Alice (ALICE) is expected to continue with the nearest resistance at 22,000-27,000, while the weakness will test the price of 15,000-19,000, where both prices will be crucial for My Neighbor Alice (ALICE) to determine the next trend movement.
2. T-mac DAO (TMG)

The MACD indicator indicates that the line has cut upwards, indicating that the T-mac DAO (TMG) trend is positive. The price of T-mac DAO (TMG) is inversely proportional, where the price does not show significant positive changes. This is because the candles have been unable to break the 200,000-240,000 area.
3. Reserve Rights (RSR)

The Reserve Rights (RSR) bearish trend will experience negative pressure if the 115-130 resistance area can be broken and will increase the possibility of the EMA/200 being broken as well, so the trend switch to bullish will be quite large to be realized.
4. The Sandbox (SAND)
 The price decline of The Sandbox (SAND) is deepening. Since entering the bearish trend on April 10, 2024, The Sandbox (SAND) has weakened by more than 20%, and The Sandbox (SAND) is expected to decline further if it fails to hold above the 6,700-7,1000 area.
5. OMG Network (OMG)

The potential for OMG Network (OMG) to correct prices will be great if the line in the 11,000-13,000 area range can be crossed and the possibility of moving above the WMA/75. This must be followed by a high enough price strengthening to create positive momentum in the OMG Network (OMG) trend.
NOTES:
If EMA 5 crosses the WMA 75, 85, and EMA 200 lines, and these lines intersect from bottom to top, then the market trend tends to be upward (bullish).
Each table above shows that when the value of EMA 5 is higher than WMA 75,85 and EMA 200, the market tends to rise (bullish).
If the RSI and MACD values show the same condition, the market is showing the same trend; an overbought (overbought) or oversold (oversold) condition indicates that the market is at the point of changing trend direction.
 Market

