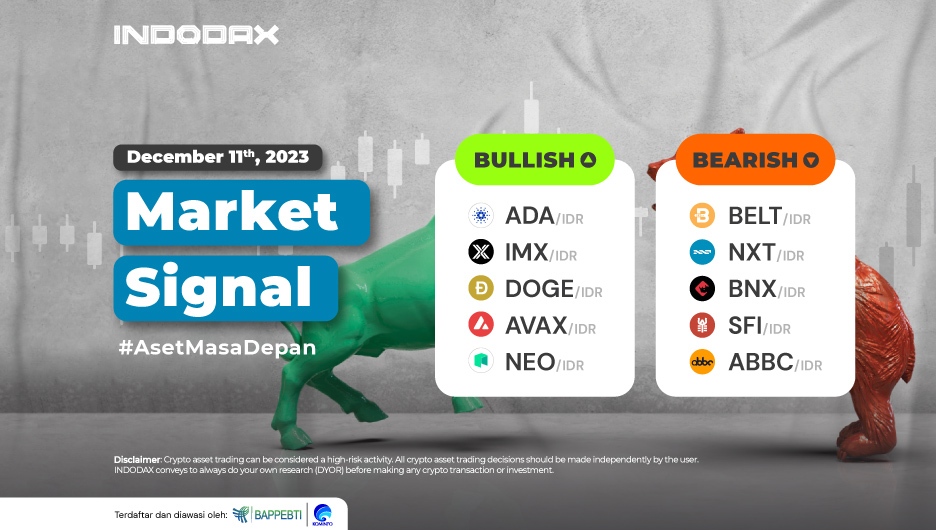
This week, Cardano (ADA) and Immutable X (IMX) appear on the list of bullish crypto assets, accompanied by Dogecoin (DOGE), which is still holding up since last week.
Do you know which other crypto assets are experiencing bullish or bearish trends this week? Check out the complete INDODAX Market Signal update below!
5 Bullish Crypto Assets
1. Cardano (ADA)

Cardano (ADA) price strengthening occurred quite high. Since being on a bullish trend, Cardano (ADA) has surged by more than 40%. The RSI indicator indicates that Cardano (ADA) is overbought, so the potential for correction is quite large, with an estimated support level of around 8,800-8,000.
2. Immutable X (IMX)
 The price of 32,000-36,000 is a level that, if Immutable X (IMX) can pass, makes the possibility of a stronger trend to the 40,000 level range even greater. The 1-day trend of the MACD indicator indicates that Immutable X (IMX) is in a positive area.
3. Dogecoin (DOGE)

Dogecoin (DOGE) in the 1-day timeframe is assumed to be quite volatile. This is following the Bollinger Bands indicator. The trend movement in the bullish zone will become stronger if the Dogecoin (DOGE) candle can form above the 1,650-1,820 level.
4. Avalanche (AVAX)

The bullish Avalanche (AVAX) trend on the 1-day timeframe will increasingly dominate if a candle can form above the 600,000-670,000 area. Assuming that Avalanche (AVAX) cannot pass this area, a potential support level is available in the 420,000-480,000 area.
5. Neo (NEO)

The 1-day price movement of Neo (NEO) can be indicated if it is currently moving in the bullish zone. Prices can cross the upper line of the Bollinger Bands indicator, indicating that the pressure for price changes is quite high. The chance for Neo (NEO) to strengthen is quite high, meaning the trend will test the price of 235,000-250,000.
5 Bearish Crypto Assets
1. Belt Finance (BELT)

Belt Finance (BELT) was able to stay above the 1,000-1,050 support area with a candle that strengthened and moved above WMA/85. The Belt Finance (BELT) bearish trend will fail to continue if the dominant resistance level of 4,300-5,100 is broken, followed by a candle moving above the EMA/200.
2. NXT (NXT)

NXT (NXT) failed to maintain price movements above WMA/85, and the resistance area 28-35, which is quite a dominant area, could not be passed. The potential for NXT (NXT) to strengthen again is quite wide open if the 20-25 area can be penetrated.
3. BinaryX (BNX)

The MACD indicator indicates the BinaryX (BNX) trend on the 4-hour chart to be in the sideways area. Confirmation will be created and become positive momentum if the trend can stay above EMA/200, thus testing the price of 700,000-840,000 for BinaryX (BNX).
4. saffron.finance (SFI)
 The failure of the candle to pass the EMA/200 made the price of saffron.finance (SFI) weakened again, following the current trend. If the candle cannot stay above the 310,000-360,000 level, it will make the saffron.finance (SFI) bearish trend even stronger to continue.
5. ABBC Coin (ABBC)

ABBC Coin (ABBC) could not continue strengthening past 750-780. This cannot be separated from the trend already in the overbought area. The trend of ABBC Coin (ABBC) will be able to correct the price weakness if the candle moves above the 1,000 level.
NOTES:
If EMA 5 crosses the WMA 75, 85, and EMA 200 lines, and these lines intersect from bottom to top, then the market trend tends to be upward (bullish).
Each table above shows that when the value of EMA 5 is higher than WMA 75,85 and EMA 200, the market tends to rise (bullish).
If the RSI and MACD values show the same condition, the market is showing the same trend; an overbought (overbought) or oversold (oversold) condition indicates that the market is at the point of changing trend direction.


 Polkadot 8.91%
 BNB 0.45%
 Solana 4.80%
 Ethereum 2.37%
 Cardano 1.65%
 Polygon Ecosystem Token 2.13%
 Tron 2.85%
 Market


