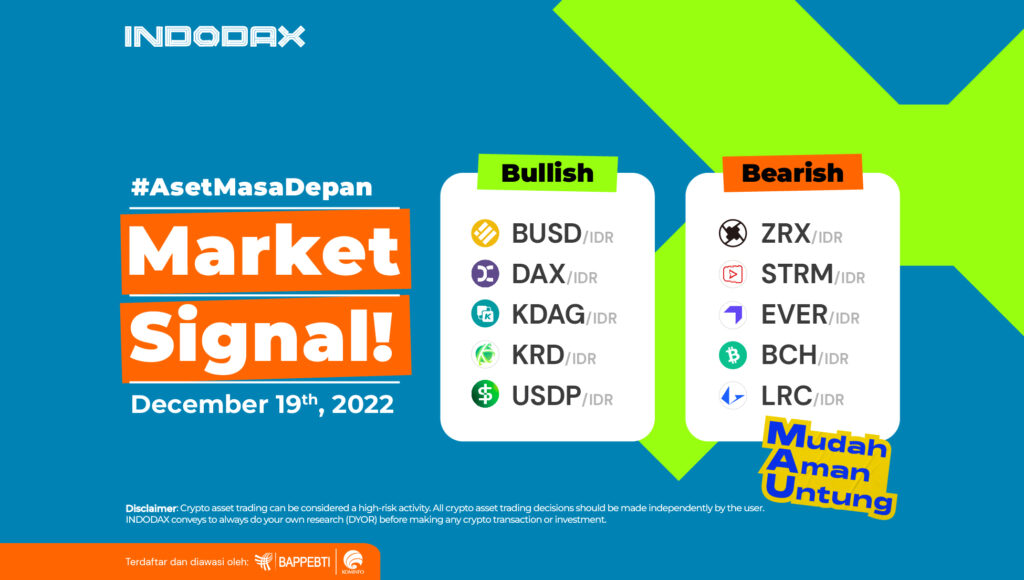
KRD recently touched the price range of 28,000, which is the highest price since listing on Indodax! Check out the following market signals to find out more about crypto assets that are indicated to be bullish and bearish!
5 Bullish Crypto Assets
-
BinanceUSD (BUSD)

The stay of BUSD in the bullish zone is inseparable from the trend being able to not penetrate below the 15,400 level so that the movement to strengthen is wide open. The price will continue its positive movement if it can create a new trend above the 15.845 – 15.920 area.
The MACD indicator also shows a strengthening trend. In 1 day of use, the line has crossed upwards so that the movement is in the positive zone.
The bullish trend on Binance USD will be suppressed if the consolidation breaks the Support level at 15,490 – 15,630 so that a break of the WMA/85 line will open wide.
-
DAEX (DAX)

It touched the price level up to around 92 on December 16, 2022, but was unable to strengthen higher. Instead, it experienced a correction. The RSI indicator indicates that the price is already in the Overbought area. The bullish phase of the DAEX will be suppressed if the price cannot create a new trend above level 75.
-
KingDAG (KDAG)

On December 12, 2022, KDAG once touched the price of around 3,850, but the price continued to decline. This was due to the Candle’s inability to penetrate the Resistance level of about 4,000. If the weakening occurs, it will try to stay above the 1,950 – 2,120 area. If the price can remain above that level, it will increase King DAG’s indication to strengthen again, but vice versa. If it weakens and passes that level, it will increase negative momentum for KDAG.
-
Krypton DAO (KRD)

The 4-hour chart shows that KRD has been in the bullish area since December 3, 2022, confirmed by the emergence of a positive candle that is quite strong and ends the previous phase of KRD, namely the Sideways Downtrend.
KRD recently touched the price range of 28,000, which is the highest price since listing on Indodax. The price will still have positive momentum to continue strengthening if Krypton DAO keeps the Support area of 13,000 – 15,345.
-
Pax Dollars (USDP)

Suppose you look at the description of the movement of USDP through the 1-day time frame. In that case, it can be indicated if USDP has fluctuating price changes where the Candle has a reasonably long shape, and the two lines of the Bollinger Bands indicator are moving away.
The trend will try to create a new movement above the price area of 15.995 – 16.030, further strengthening Pax Dollar’s position in the bullish zone.
5 Bearish Crypto Assets
-
0x (ZRX)

Since being in the Bearish zone on December 20, 2021, ZRX has weakened to around 75%. The weakening that occurred in the Bearish trend will improve if the Candle can move from the Resistance area at 3,100 – 3,700 so that it will encourage an increase in the price of ZRX.
-
StreamCoin (STRM)

The downward trend in StreamCoin is in line with one of the indicators used, such as MACD, which indicates that the movement is in a hostile area. The weakening touched the lowest price of StreamCoin since it was first traded on Indodax.
The weakening will test the support level available at the price of 220. Conversely, if the price can penetrate the price of 245, it will increase the possibility of going to the area of 260 – 270.
-
Everscale (EVER)

The decline in EVER deepened after the price could not cross the WMA/75 line. This indicates that if you look at the overall price movement, you can see that it has continued to decline since the first listing on Indodax Everscale.
The RSI indicator shows that the price is currently in the oversold area, which is reasonable considering that EVER has experienced a deep correction.
-
Bitcoin Cash (BCH)

The 1 Day time frame shows if BCH has been in the Bearish zone since December 02, 2022.
If you look at the Bollinger Bands indicator, price movements will be more limited with a range of activities in the 1,460,000 – 2,100,000 area. A break of one of the levels will confirm the direction of the next trend movement.
-
Loopring (LRC)

After penetrating the EMA/200, the price weakened, which is in line with the RSI, indicating that the price is already in the Overbought area. The price will show a positive change if it can pass through the 4,320 – 5,500 region, increasing the chances of the Loopring breaking the 7,500 level.


