Cardano (ADA) leads the pack of crypto assets on a bullish trend this week, to Maker (MKR), which has seen a price increase of over 100 percent.
Curious about what crypto assets are experiencing bullish or bearish trends this week? Check out the full INDODAX Market Signal update below!
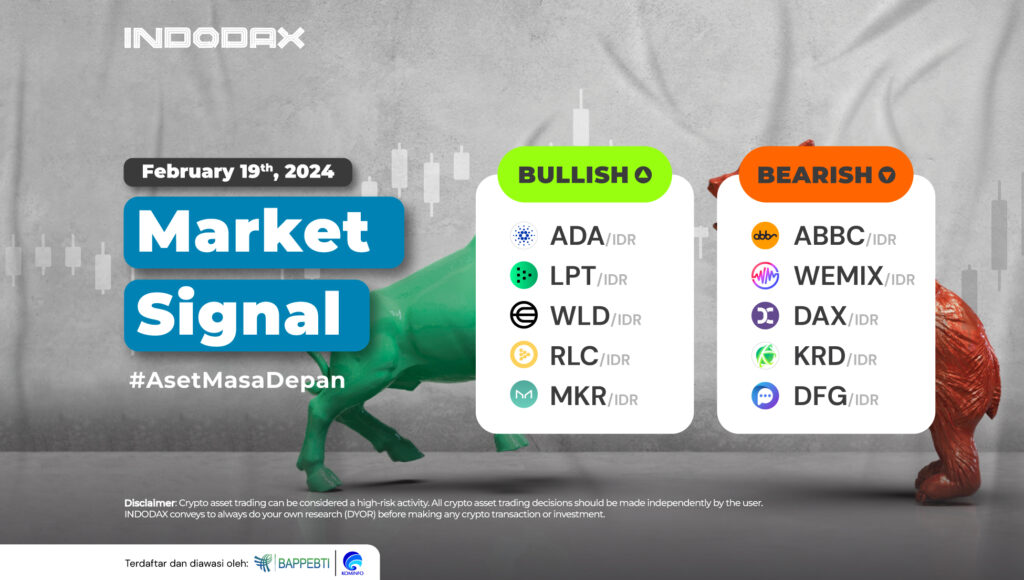
5 Bullish Crypto Assets
1. Cardano (ADA)

Being in the uptrend zone on November 26, 2023, has quite a positive impact and is in line with the direction of the trend change that occurred on Cardano (ADA), whose price has strengthened by more than 50%. The bullish trend is assumed to be stronger to continue if the resistance level in the price range of 11,000-14,500 with a wide enough position can be passed and a candle is formed above the resistance.
2. Livepeer (LPT)

The strengthening is high enough to make the Livepeer (LPT) trend currently in the overbought area on the RSI indicator, where Livepeer (LPT) managed to touch its highest price since listing on INDODAX. Strengthening Livepeer (LPT) opens quite large, but if it happens otherwise, there is a support area in the range of 220,000-240,000.
3. Worldcoin (WLD)

Starting with a fairly dominant resistance in the 45,000-52,500 area, Worldcoin (WLD) can be broken so that the candle can move from the EMA/200. The MACD indicator indicates that the trend is on a positive path. If the price of 90,000-95,000 is broken, the bullishness will be stronger.
4. iExec RLC (RLC)
 Being in a bullish zone impacts the price of iExec RLC (RLC), which has strengthened enough to touch the highest level. Dominating support is available in the range of 30,000-40,000. If this area is broken, the uptrend phase will be under pressure.
5. Maker (MKR)

The price increase of Maker (MKR) has been more than 100% since it was in an uptrend phase on July 27, 2023. When viewed from the 1-day chart, the bullish trend is quite strong, and the positive momentum can dominate the price movement. The WMA/85 is expected to be broken by the candles if the support of 27,500,000-30,000,000 cannot withstand the price weakness.
5 Bearish Crypto Assets
1. ABBC Coin (ABBC)
 Although it passed and stayed above the EMA/200, ABBC Coin (ABBC) returned to correction until it was back in the bearish trend and weakened again. The trend is overbought, and MACD shows the negative side as one indication that this can happen.
2. WEMIX (WEMIX)

On the trend movement of WEMIX (WEMIX) in the 4-hour chart, it can be estimated if the bearish phase cannot be resumed, if the WMA/75 can be broken and then followed by a candle that forms above the 46,000-55,000 area.
3. DAEX (DAX)

Currently, DAEX (DAX) is indicated to be in a downtrend phase, but MACD shows the opposite, where it will be determined by the candles along with the price of DAEX (DAX), which, if it is at the 100 level, can be a reference for the upcoming trend change.
4. Krypton DAO (KRD)

Not forming a candle above the 20,000 area is one indication that Krypton DAO (KRD) cannot continue to strengthen. The support area of 9,800-11,500 is the dominant area for Krypton DAO (KRD) to be used as a reference if the price weakens.
5. Defigram (DFG)

The bearish trend on Defigram (DFG) has been going on since May 18, 2023, after Defigram (DFG) touched its highest price. Weakening the price of Defigram (DFG) to move below 27,500-30,000 will weigh on the trend to correct the weakened price.
NOTES:
If EMA 5 crosses the WMA 75, 85, and EMA 200 lines, and these lines intersect from bottom to top, then the market trend tends to be upward (bullish).
Each table above shows that when the value of EMA 5 is higher than WMA 75,85 and EMA 200, the market tends to rise (bullish).
If the RSI and MACD values show the same condition, the market is showing the same trend; an overbought (overbought) or oversold (oversold) condition indicates that the market is at the point of changing trend direction.
 Market

