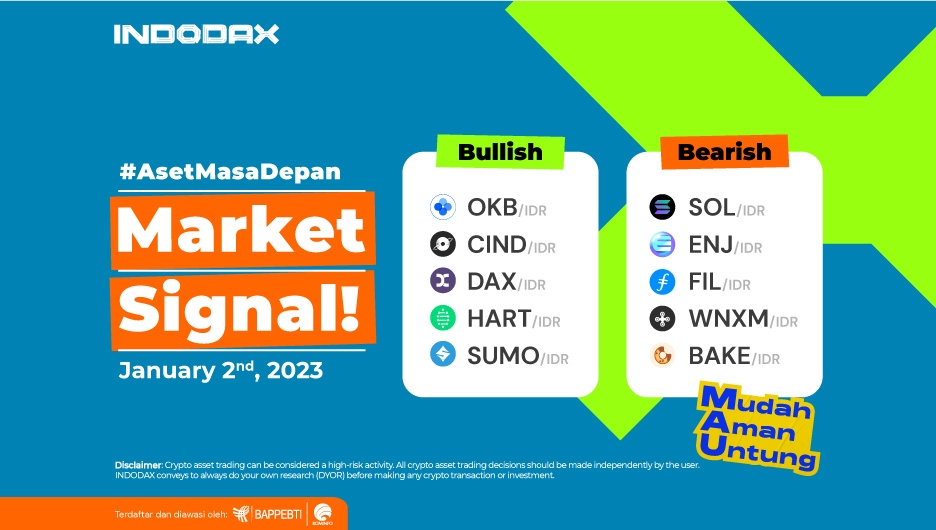
Happy new year, Indodax members! Welcoming the beginning of 2023, OKB is in the top position for bullish crypto assets, you know! Come on, see which coins indicate bullish and bearish in full here!
5 Bullish Crypto Assets
OKB (OKB)

It was strengthened enough to break the EMA/200 after holding above the Support area of 220,000 -241,200, generating positive momentum that could change the trend from Bearish to Bullish.
It had weakened to the level of 270,000, but the price resumed strengthening in the direction of the movement. Holding above WMA/75 would indicate OKB to test 480,000 – 510,000 levels.
Cindrum (CIND)

Confirmation of the Bullish trend can be ascertained. During the 4 hours, the Bollinger Bands indicator previously showed a narrowing in the movement. Then there was a steady increase in demand so that it could break the level around 12 and end the Sideways Bearish trend to become an Uptrend.
If you see one of the indicators used, MACD, it indicates that it is currently in the Sideways phase with a range of movements in the 23-31 area.
DAEX (DAX)

On the 4-hour chart, the DAEX continues to show positive price changes, which can break the resistance level, which is quite dominant in the 70 – 80 area. A positive signal will enable the DAX to penetrate the 130 area level. Bullish will be stronger.
Hara Token (HART)

HART has been in the bullish area since December 21, 2022, when the price was able to break through the 32 levels, followed by the price staying above WMA/85, even touching the price at 70.
Movement in the Bullish zone will be threatened with turning to a Bearish trend if price weakening occurs and penetrates the Support level in areas 31-35.
Sumokoin (SUMO)

After the resistance level in the range of 185 – 195 is broken, there is an indication that SUMO is strengthening, which is the trend turning point when Sumokoin can break EMA/200, which indicates positive momentum in SUMO.
The trend will remain in the bullish zone if SUMO can pass the resistance level, which is quite dominant in positions 200 – 220.
5 Bearish Crypto Assets
Solana (SOL)

On the one-day chart, the EMA/200 down break became a negative momentum for Solana, weakening deep enough to break several support levels, such as 310,000 and 205,000.
The Bollinger Bands indicator illustrates if the two lines are far from each other, thus indicating that Solana will move quite dynamically.
A dynamic trend movement will create opportunities for strength and weakness wide open. If it strengthens, it will move towards the price of 170,000 while reversing this assumption. A weakening will test the 137,000 – 146,500 area.
Engine Coin (ENJ)

Enjin Coin’s inability to stay above the Support level of 6,300 – 6,720 made the price continue to experience a profound weakening. The trend will move to correct the weakness if it can hold above the 5,000 level. The RSi indicator requires further confirmation to confirm the trend direction.
Filecoins (FIL)

If you look at the direction of the overall trendline with a 4-hour timeframe, it can be identified if Filecoin is in the Downtrend phase. Assuming the use of the Bollinger Bands indicator, the price is currently moving limited with a range of price movements of 44,000 – 51,500.
If the entire candle can penetrate one of the levels, this will confirm the direction of the next candle movement.
Wrapped NXM (WNXM)

It is indicated that WNXM has been in the bearish zone since January 24, 2022, with prices weakening, which have touched around 70%. This significant weakening has made WNXM handle the lowest price level while trading on Indodax several times.
Strengthening the trend will likely occur, considering the weakening. The nearest resistance level is around the 144,000 – 200,000 area. A break of this level will make Wrapped NXM pass WMA/75.
BakeryToken (BAKE)

After being able to strengthen and touch the 3,540 level, this was the turning point for BakeryToken to weaken. The weakening deepened after BAKE could not hold above the support level 2,940 – 2,980, so it entered the Bearish zone.
The price of BAKE in the Bearish Zone will be corrected if the price can break the level 2.090 – 2.290. Assuming this, the chance to stay above WMA/85 will be wide open.
NOTE: If the 5 EMA crosses the WMA 75, 85 and 200 EMA lines and the lines intersect from the bottom up, then the market trend tends to go up (bullish), each table above shows that if the 5 EMA value is higher than the 75.85 WMA and 200 EMA, the market tends to go up (bullish).
If the RSI and MACD values ??show the same condition, it means that the market is showing the same trend. Overbought or oversold conditions are an indicator that the market is already at the point of changing direction of a trend.
ATTENTION: All contents which includes text, analysis, predictions, images in the form of graphics and charts, as well as news published on this website, is only used as trading information, and is not a recommendation or suggestion to take action in transacting either buying or selling. certain crypto assets. All crypto asset trading decisions are independent decisions by the users. Therefore, all risks arising from it, both profit and loss, are not the responsibility of Indodax.


