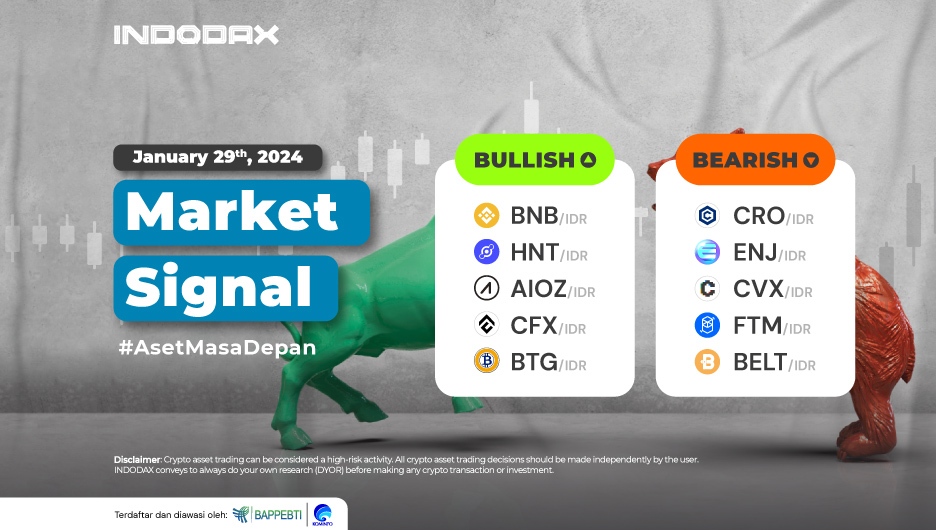
The positive trend of crypto assets this week was led by Helium (HNT), Conflux (CFX), to Bitcoin Gold (BTG) in the bullish range.
Curious about what crypto assets are experiencing bullish or bearish trends this week? Check out the full INDODAX Market Signal update below!
5 Bullish Crypto Assets
1. BNB (BNB)

Although the MACD indicator indicates the trend of BNB (BNB) to be in a negative area, it does not significantly impact price changes. BNB (BNB) could stay above the WMA/85. If a candle can form above the price of 5,000,000-5,500,000, it will make BNB (BNB) even more dominant in the bullish trend.
2. Helium (HNT)

Helium (HNT) looks successful to continue strengthening. This is inseparable from the trend that did not weaken until it passed the WMA/85 and the support area of 64,000-81,000. Helium (HNT) has potential resistance at the 140,000-180,000 level, where this level will be decisive for the movement of Helium (HNT).
3. AIOZ Network (AIOZ)
 The trend that has been unable to cross the 3,000-4,000 area has put negative pressure on AIOZ Network (AIOZ). The MACD indicator indicates the same thing where the price of AIOZ Network (AIOZ) is weakening, with the closest support level in the 1,700-1,840 area.
4. Conflux (CFX)

The opportunity for Conflux (CFX) to strengthen is quite wide open, where the positive slash line on the MACD indicator makes opportunities for Conflux (CFX). However, if the candle does not form above the 3,730-4,300 area, then Conflux (CFX) is still on hold to wait for the next price movement.
5. Bitcoin Gold (BTG)

Bitcoin Gold (BTG) strengthening stopped in the range of 420,000-450,000, but if this level can be passed, the potential to test a fairly dominant resistance area in the range of 600,000 will be quite large. The potential for Bitcoin Gold (BTG) to weaken is quite large after experiencing quite high strengthening. If the price of 200,000-240,000 is passed, negative momentum will dominate the trend movement of Bitcoin Gold (BTG).
5 Bearish Crypto Assets
1. Crypto.com Chain (CRO)

Crypto.com Chain’s (CRO) downtrend phase has been confirmed since January 10, 2024, where the bearishness is getting stronger as the candles cannot hold above the 1,400-1,485 zone. The RSI indicator is yet to show a confirmed move for Crypto.com Chain (CRO), so more time is needed.
2. Enjin Coin (ENJ)

When looking at the chart with the 4-hour timeframe, the downtrend phase of Enjin Coin (ENJ) will fail to resume if the trend can cross the 6,200-6,815 area, where it is assumed that the candles will move higher in line with the EMA/200.
3. Convex Finance (CVX)

Convex Finance (CVX) has been unable to switch from a bearish to a bullish trend even though the candles are moving above the WMA/200. The trend did not break the resistance area of 73,000-80,000, so Convex Finance (CVX) should continue the bearish trend. The bearish trend will dominate more if Convex Finance (CVX) cannot hold above 30,000.
4. Fantom (FTM)

Fantom (FTM) will be confirmed to enter the uptrend phase if the EMA/200 can be passed, then it must also be followed by resistance with the dominant position of 6,800-7,200 being broken which causes positive momentum to be more dominant.
5. Belt Finance (BELT)
 Belt Finance (BELT) trend will move positively if the candles can move higher in line with the WMA/85 and will test the dominant area for Belt Finance (BELT) in the range of 1,700-2,000, where this area is quite important for changes in Belt Finance (BELT) price movements.
NOTES:
If EMA 5 crosses the WMA 75, 85, and EMA 200 lines, and these lines intersect from bottom to top, then the market trend tends to be upward (bullish).
Each table above shows that when the value of EMA 5 is higher than WMA 75,85 and EMA 200, the market tends to rise (bullish).
If the RSI and MACD values show the same condition, the market is showing the same trend; an overbought (overbought) or oversold (oversold) condition indicates that the market is at the point of changing trend direction.


