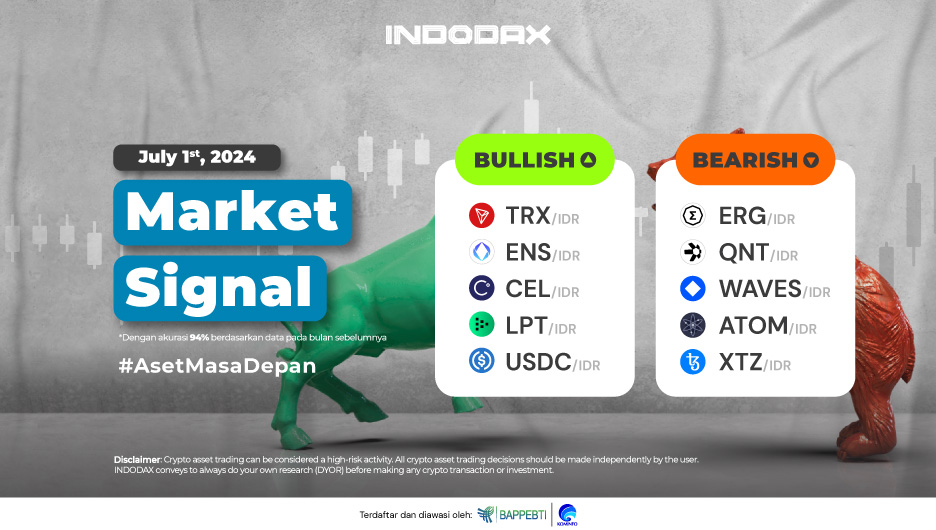
This week, the bullish crypto asset lineup is led by Tron (TRX) in the first position, and followed by Ethereum Name Service (ENS) and Celsius (CEL).
Want to know the performance of your favorite crypto assets? Check INDODAX Market Signal below!
5 Aset Kripto Bullish
1. Tron (TRX)

Tron (TRX) Bullish Phase has been going on since March 11, 2023, the price moved up more than 90% where this happened slowly Tron (TRX) tried to test its highest price in the range of 2,550 – 2,700.
The price was able to move above the WMA/75 again, the price weakened past the EMA/200 but no candle formed a positive impact on the MACD indicator which cut upwards.
2. Ethereum Name Service (ENS)

Had been in the Bearish zone because the 375,000 – 400,000 level was successfully broken so that it was followed by a weakening trend until it was below the EMA/200, but the price of Ethereum Name Service (ENS) experienced an improvement after being stuck in the Support area 180,000 – 200,000 making Ethereum Name Service (ENS) experience a high enough increase to break the Resistance zone 275,000 – 300,000.
3. Celsius (CEL)

Celsius (CEL) is currently held by the WMA/85, with the opportunity to experience a wide open correction available Support around the price of 12,000 – 15,000 on the other hand Resistance is indicated in the area of 17,000 – 20,000.
4. Livepeer (LPT)

Livepeer (LPT) Bearish phase will be created if EMA/200 cannot withstand the correction that occurs, then followed by the 145,000 – 205,000 Support area must be broken by Candle where this area becomes a crucial area for Livepeer (LPT).
5. USD Coin (USDC)

The 1-Day Chart indicates that USD Coin (USDC) is strengthening but slowly, the trend is moving above the EMA/200 so the opportunity to continue the Bullish trend is quite large. The creation of candles above the level of 16,800 – 17,000 will further distance USD Coin (USDC) from the Bearish trend.
5 Aset Kripto Bearish
1. Ergo (ERG)

Candle moves below WMA/85, impacting the movement of Ergo (ERG) experiencing negative momentum pressure. MACD indicator is still moving SIdeways, requires more time to confirm the direction of the trend movement with the nearest support at 13,000 – 14,000.
2. Quant (QNT)

The bearish trend is indicated to continue by the weakening movement of Quant (QNT). The expectation of a price drop will still be realized, if the nearest Resistance 1,300,000 – 1,500,00 is not broken where the RSI will provide confirmation whether the trend will be in the Oversold area or can move away.
3 Waves (WAVES)

The negative movement of Waves (WAVES) is confirmed, the trend is weakening where it moves below the EMA/200 then the WMA/85 cuts down impacting the end of the Bullish trend and the price has corrected around 50%. Currently the RSI indicator indicates that the trend is in the Oversold area, the trend will be able to improve if the 20,000 area can be passed.
4. Cosmos (ATOM)

Since being in the Bearish phase on May 21, 2024, Cosmos (ATOM) has corrected more than 20%. The downtrend is deepening, the price is unable to hold above the Support area of 125,000 – 132,000 with the next Support level available at 90,000 – 100,000 which is the dominant level.
5. Tezos (XTZ)

Bearish trend on the 1-Day chart, indicated that positive pressure will be created if the 15,500 – 18,000 area can be broken, this must be followed by a trend that breaks the WMA / 85 so that the Bearish phase will experience pressure.
NOTES:
If the EMA 5, crosses the WMA 75, 85 and EMA 200 lines, and the lines intersect from bottom to top, then the market trend is upward (bullish).
Each table above shows that if, the value of EMA 5 is higher than WMA 75, 85 and EMA 200, then the market is trending up (bullish).
If the RSI and MACD values show the same condition, it means that the market is showing the same trend, overbought (overbought), or oversold (oversold) conditions are one indicator that the market is at the point of changing the direction of the trend.


 Polkadot 9.04%
 BNB 0.45%
 Solana 4.76%
 Ethereum 2.37%
 Cardano 1.75%
 Polygon Ecosystem Token 2.16%
 Tron 2.85%
 Market


