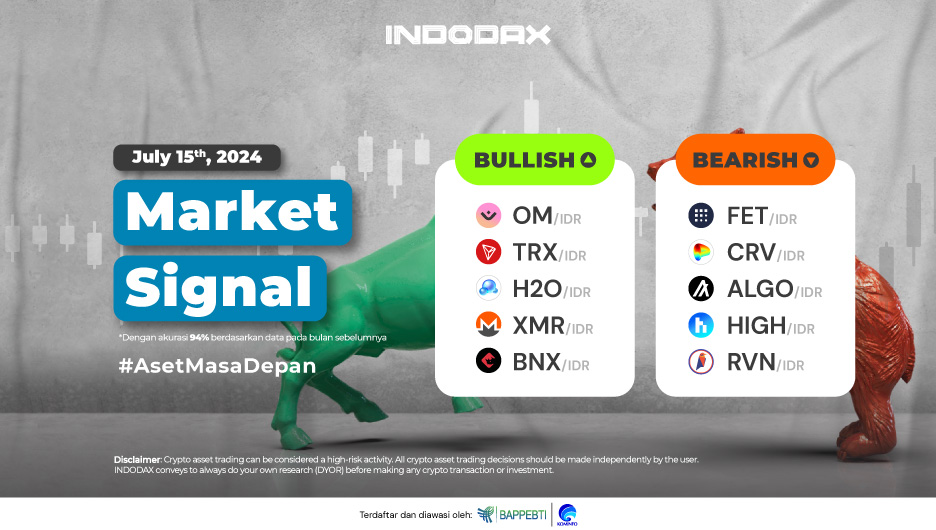
This week, the bullish crypto asset lineup is led by MANTRA (OM) in the first position, and followed by Tron (TRX) and H2O DAO (H2O).
Want to know the performance of your favorite crypto assets? Check INDODAX Market Signal below!
5 Bullish Crypto Assets
1. MANTRA (OM)

MANTRA (OM) has been in the bullish zone since July 06, 2024, where the price of MANTRA (OM) has increased by around 30%. MANTRA (OM) had touched the level of 18,250 which is the highest price of MANTRA (OM) since it was traded on INDODAX. The price of MANTRA (OM) will have the potential to continue strengthening if the candle can move above 18,400 – 19,000.
2. Tron (TRX)

Trend yang ditunjukkan Tron (TRX) bergerak positif, di mana fase Bullish berdampak positif terhadap perbahan harga Tron (TRX) pada chart 1 Hari. Koreksi pada Tron (TRX) tidak membentuk Candle dibawah area 1,600 – 1,800 harga mengalami Rebound lebih dari 15% dengan Tron (TRX) menuju ke level 2,300.
3. H2O DAO (H2O)

Strengthening the bullish trend of H2O DAO (H2O) can be realized after the candle can move positively to strengthen above the WMA / 85 then the Resistance area of 4,000 – 4,500 is passed. Trend moves weakened after being in the Overbought area with a successful trend moving above 7,100 – 8,000 will increase the chances of the trend returning to the area.
4. Monero (XMR)

On the 1-Day chart, Monero (XMR) is indicated to have just entered a Bullish trend with the current price being held by the WMA/75. Bullish will fail to continue if the Candle no longer moves above the price of 1,900,000 – 2,150,000 but on the contrary with the passing of Resistance 2,900,000 – 3,100,000, the Bullish is getting stronger.
5. BinaryX (BNX)
 Passing Resistance levels such as 45,000 – 60,000 is a key factor for BinaryX (BNX) to end the Sideways Bearish phase and start the Bullish transition phase. The MACD indicator indicates that BinaryX (BNX) needs time to be able to confirm the direction of the trend movement with the Support area available at a fairly wide price range of 1,300,000 – 1,700,000.
5 Bearish Crypto Assets
1. Fetch.ai (FET)

Fetch.ai (FET) was confirmed to be in the Downtrend phase on June 03, 2024, the price has corrected more than 40%. Support with a dominant position indicated in the range of 17,500 – 20,000 area is expected to weaken further for Fetch.ai (FET) with this area that can be broken.
2. Curve DAO Token (CRV)

The bearish trend is indicated on Curve DAO Token (CRV), currently the trend is being held by WMA / 85 where the chance of a decline in Curve DAO Token (CRV) is quite large. The MACD indicator illustrates the trend will move positively, but has not seen a similar movement if the Resistance area of 5,200 – 5,800 can be broken then price recovery can occur.
3. Algorand (ALGO)

Moving higher after successfully holding above the price of 1,800 – 2,000 made the trend move rebound and strengthen to test the WMA / 85 line, if it can move above the line the potential for Algorand (ALGO) to suppress the Bearish trend is quite large.
4. Highstreet (HIGH)

The deep decline in Highstreet (HIGH) is inseparable from the switch of the Bullish trend to Bullish, the price has corrected by more than 55% since June 14, 2024. The current trend of Highstreet (HIGH) assumes that the MACD indicator is in a Sideways phase, with a breakout of the 29,000 – 39,000 area will end positively.
5. Ravencoin (RVN)
 The trend is able to move positively in line with the WMA / 75, the Bearish trend will experience pressure if above 370 – 440 can form a candle so it is estimated that the EMA / 200 will experience the same thing, the price will then try to test the 500 – 600 area, the potential for a Bullish phase to form is quite possible.
NOTES:
If the EMA 5, crosses the WMA 75, 85 and EMA 200 lines, and the lines intersect from bottom to top, then the market trend is upward (bullish).
Each table above shows that if, the value of EMA 5 is higher than WMA 75, 85 and EMA 200, then the market is trending up (bullish).
If the RSI and MACD values show the same condition, it means that the market is showing the same trend, overbought (overbought), or oversold (oversold) conditions are one indicator that the market is at the point of changing the direction of the trend.


 Polkadot 8.92%
 BNB 0.40%
 Solana 4.83%
 Ethereum 2.37%
 Cardano 1.35%
 Polygon Ecosystem Token 2.12%
 Tron 2.85%
 Market


