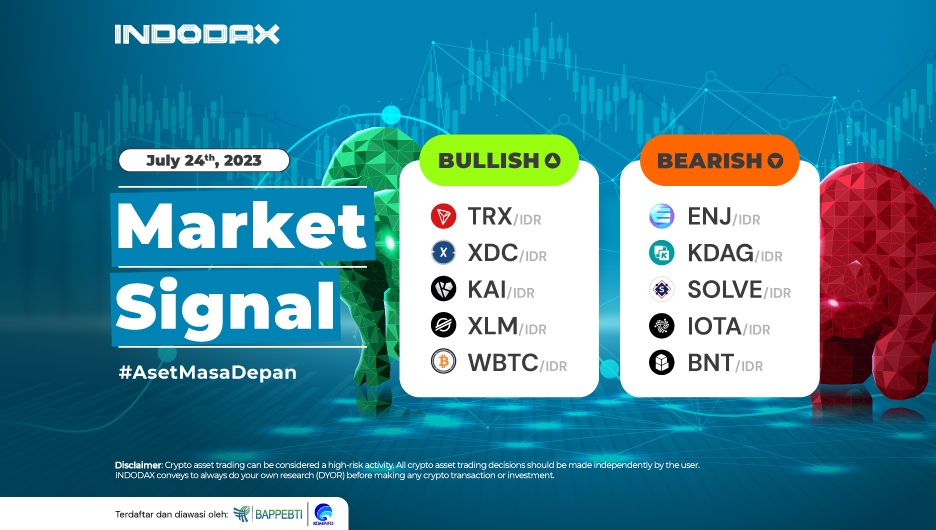
Good news for Indodax loyal traders because in the last week of this July, the crypto market witnessed rapid spikes in several crypto asset values.
Tron (TRX), Xinfin Network (XDC), and Kardiachain (KAI) are in the spotlight as crypto assets are showing an interesting bullish trend. If you are curious, let’s look at the latest market signals on INDODAX Academy to learn more about crypto assets showing bullish and bearish potential this week.
5 Bullish Crypto Assets
1. Tron (TRX) Coin

The movement of the crypto asset Tron (TRX) coin since being in a bullish trend on February 20, 2023, continues to show positive price changes; after successfully rebounding from the WMA/75 line Tron has strengthened and crossed the 1,085 level.
Strengthening has made the current trend in the overbought area on the RSI indicator, weakening which, if it occurs, will try to test the strength of Resistance at the level of 1,130 – 1,160.
2. XinFin Network (XDC) Coin

The dominant sideways phase makes price movements more limited in the price range of 450 – 550; on July 19, 2023, the Xinfin network (XDC) coin can break the resistance level so that confirmation for a rally in a positive direction can be created.
The trend has not passed the price of 900; if this level can be penetrated, then the XinFin Network will be even stronger in a bullish trend.
3. Kardiachain (KAI) Coin

In the 4-hour time frame, the cryptocurrency asset (KAI) coin ended the Bearish trend on July 16, 2023. A candle with a dominant positive shape can break the resistance level in the 57 – 66 area.
The current trend is still stuck at the WMA/85 line, so it takes further time to determine the direction of price movement.
The MACD indicator illustrates that currently, the line has crossed with the line crossing downwards. The support area is available in the range of 64 – 68 levels.
4. Stellar Lumens (XLM) Token

The movement of stellar lumens (XLM) tokens on the 1-day chart are quite positive; the trend illustrated by the MACD indicator shows that currently, it is in a positive phase.
If you see that the trend has moved away from the overbought area, but you have to be more careful, a correction will test the support level at 1.860 – 2.040.
5. Wrapped Bitcoin (WBTC) Coin

Looking at the overall trend movement on the 1-day chart, if the price changes on the Wrapped Bitcoin (WTBC) coin are significant enough, several times the line from the Bollinger Bands indicator can be passed. If the price can move in harmony above WMA/75, then it will have the opportunity to move towards the 465,000,000 – 520,000,000 area.
5 Bearish Crypto Assets
1. Engine (ENJ) Coin

Since being in the Bearish trend on February 18, 2022, Enjin (ENJ) coin has experienced a correction to around 80%. The current trend is above WMA/85, enabling ENJ to strengthen through resistance levels 5,220 – 6,415.
2. King DAG (KDAG) Coin

King DAG (KDAG) coin on the chart often forms the end of a fairly long candle; this must be considered further. If King DAG can form a candle above EMA/200 and must be followed by a break in the Resistance in the area of 3,270 – 3,700, then the bearish phase will be in danger of being unable to continue.
3. Solve (SOLVE) Tokens

Not being able to break and stay above EMA/200 made the token’s correction of the Solve (SOLVE) crypto asset deeper. The trend will be able to be corrected if SOLVE can move from WMA/85, then Resistance at 330 – 350 can be passed.
4. IOTA (IOTA) Coin

The crypto asset IOTA (IOTA) coin is going down because the Candle failed to penetrate EMA/200. The MACD indicator indicates that IOTA is in a negative direction but is more limited because the price is experiencing Sideways Bearish in the price range of 2,200 – 3,200. If one of the levels can be broken, it will form a new price movement for IOTA.
5. Bancor Network (BNT) Token

The Banchor Network (BNT) token experienced a deep price drop, and the Bearish trend made negative momentum dominate price movements. If the price can move from 7,500 – 9,100, then the chance for BNT Coin to stay above EMA/200 is even greater.
Hopefully, this good news will bring enthusiasm and happiness to loyal Indodax traders. The rapid surge in the value of crypto assets, especially Tron (TRX), Xinfin Network (XDC), and Kardiachain (KAI), has caught the attention of many as it shows an interesting bullish trend.
For those of you who are curious and want to follow further developments, take advantage of the opportunity to listen to other recent market signals at INDODAX Academy. These insights can help you make wise decisions in crypto trading. Happy trading, and good luck always!
Note: If the EMA 5 crosses the WMA 75, 85, and EMA 200 lines and the lines intersect from the bottom up, then market trends tend to go up (bullish). Each table above shows that if the EMA 5 value is higher than WMA 75.85 and EMA 200, the market tends to go up (bullish).
Suppose the RSI and MACD values show the same condition. In that case, the market is showing the same trend. The condition is overbought (overbought) or oversold (oversold), which indicates that the market is at the point of changing the trend direction.
Attention: All content which includes text, analysis, predictions, images in the form of graphics or charts, as well as news published on this website, is only used as trading information and is not a suggestion or suggestion to take action in a transaction either buying or selling certain crypto assets.
All crypto asset trading decisions are independent decisions by users. Therefore, all risks arising from it, both profit and loss, are not the responsibility of INDODAX.


