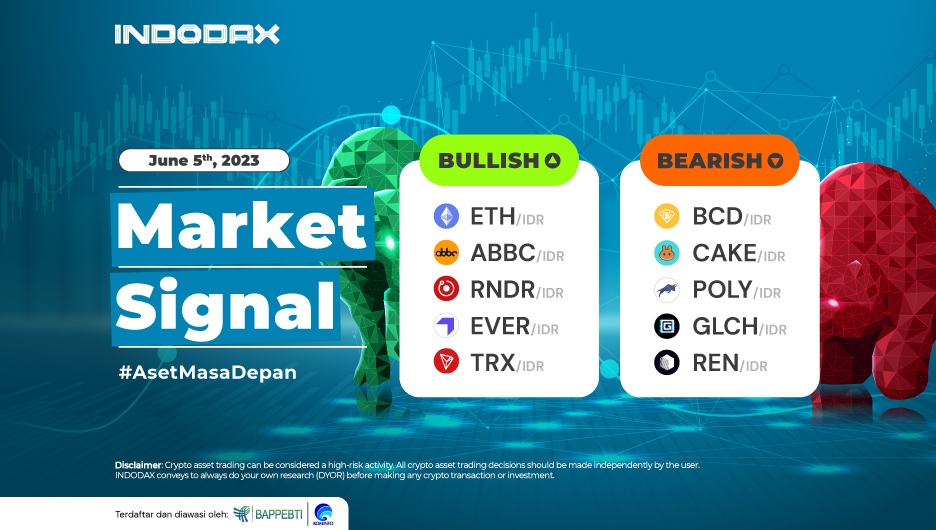
Hello INDODAX members! Welcome to June, where we are already in the middle of 2023. This week, ETH and ABBC coins dominate with the top positions in an interesting bullish trend!
So, to make it more transparent, let’s look at the complete INDODAX market signal below!
5 Bullish Crypto Assets
1. Ethereum (ETH)

On the 1-day chart, Ethereum (ETH) shows price strengthening again after weakening because it could not break from the resistance area of 29,000,000 – 29,600,000.
However, if Ethereum (ETH) manages to pass through that area, the bullish trend will get stronger. This will be followed by the MACD indicator, which will indicate price changes in the positive zone.
2. ABBC Coin (ABBC)

The strengthening of the ABBC coin (ABBC) price was quite high and significant and managed to be in a bullish trend; the movement strengthened this and penetrated the resistance level so that a positive candle formed dominant.
The RSI (Relative Strength Index) indicator indicates if the price has passed the Overbought level with the nearest Support level in the range of 2,500 – 2,600.
3. Render Tokens (RNDR)

Render Token (RNDR) can survive in the bullish phase after staying above 21,400 – 22,100, then continuing the trend to strengthen.
The resistance level is around 42,600 – 45,000. If the resistance can be passed, the potential for the Render Token (RNDR) to touch the highest level since its presence in the INDODAX Market will be large.
4. Everscale (EVER) Coin

Everscale (EVER) Coin confirmed it was in the bullish zone on May 30, 2023; strengthening pushed the price up to the 1.350 level.
The MACD indicator indicates the Everscale (EVER) Coin trend on the 4-hour time frame in a negative direction, but the nearest Support level is in the range 850 – 890.
5. Tron (TRX) Coin

Since being in the Uptrend zone on February 21, 2023, even though it had weakened to test Support at prices 820 – 905, the TRON (TRX) coin experienced a pullback, continuing the bullish trend movement.
If the movement of the TRON (TRX) coin on the 1-day chart can form a complete candle above the 1,220 – 1,400 level, the bullish trend will dominate.
5 Bearish Crypto Assets
1. Bitcoin Diamond (BCD) Coin

If further weakness occurs in the Bitcoin Diamond (BCD) coin, it will test the price in the 1,390 – 1,600 area. If this level is passed, the downward trend will deepen, so the Outlook for BCD is in a negative direction.
2. PancakeSwap (CAKE) Coin

The CAKE coin price continued to decline, unable to hold above the Support level of 48,900 – 54,000. Then the next level, at 38,000 – 42,000, was also unable to withstand the weakening of the PancakeSwap price, so the CAKE coin touched its lowest level since taking the floor on INDODAX.
RSI has moved from the oversold area on the 1-day time frame, with a strengthening which, if it occurs, will try to go to the 33,000 level.
3. Polymath (POLY) Coin

The price decline in the Polymath (POLY) coin was in line with what was shown by the MACD indicator, which indicated that the line had crossed downwards so that the trend was in a negative area.
The candle must be able not to form below the level of 1,000 – 1,500. If it is formed, the negative momentum will increasingly dominate.
4. Glitch (GLCH) Coin

Currently, on the 4-hour chart, the GLCH coin is stuck at the support area of 975 – 1,000, but the MACD indicator has shown a positive line crossing with price strengthening which, if it occurs, will test the resistance level 1,110 – 1,200.
5. Ren (REN) Coin

If the REN coin is able to stay above the price of 990 – 1,030, then the opportunity to strengthen again towards the 1,400 – 1,550 area will be even greater if this is able to realize the next price level is available at 2,000 – 2,300.
So, that’s a technical and fundamental analysis of the crypto asset market that has been carefully selected by the INDODAX analyst team at the updated Indodax Market Signal on June 5, 2023.
Don’t miss this opportunity to gain valuable insights and use the latest information to make smart investment decisions.
Keep monitoring INDODAX Market Signal to stay on the right track in the crypto investment world!
Happy Trading!
Note: If the EMA 5 crosses the WMA 75, 85, and EMA 200 lines and the lines intersect from the bottom up, then the market trend tends to be up (bullish); each table above shows if the EMA 5 value is higher than WMA 75, 85 and EMA 200, the market tends to rise (bullish).
Suppose the RSI and MACD values show the same condition. In that case, the market is showing the same trend. The condition is overbought (overbought) or oversold (oversold), which indicates that the market is at the point of changing the trend direction.
ATTENTION: All contents which includes text, analysis, predictions, images in the form of graphics and charts, as well as news published on this website, is only used as trading information, and is not a recommendation or suggestion to take action in transacting either buying or selling. certain crypto assets.
All crypto asset trading decisions are independent decisions by the users. Therefore, all risks arising from it, both profit and loss, are not the responsibility of INDODAX.


