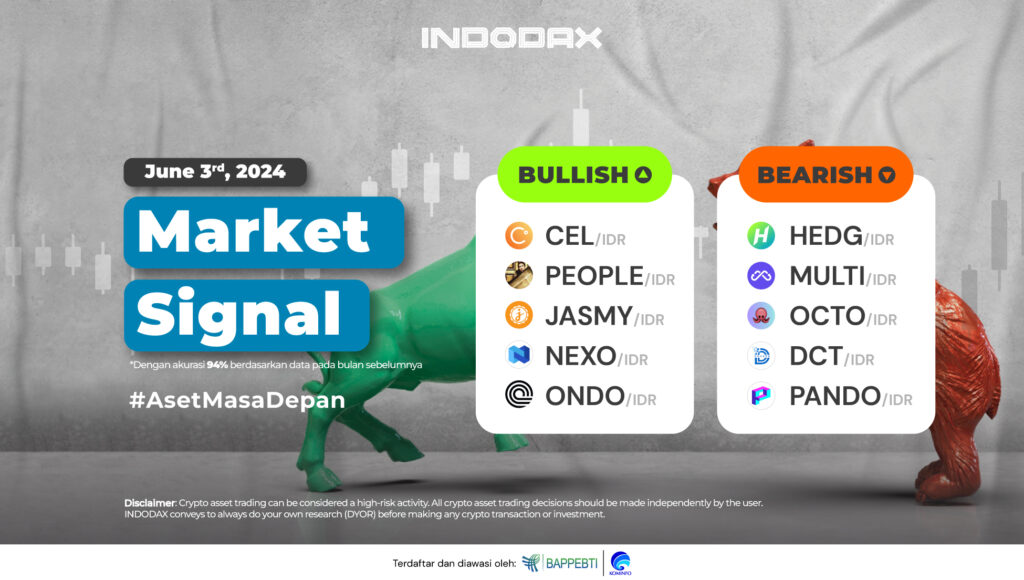
The beginning of June begins with Celsius (CEL) to Ondo (ONDO) on this week’s bullish crypto asset lineup.
Curious? Check INDODAX Market Signal below!
5 Bullish Crypto Assets
1. Celsius (CEL)
 Still moving higher, Celsius (CEL), although experiencing a correction, was held by the support of 8,200-9,300. Then, the price experienced a positive rebound until it broke through the resistance of 13,200-16,500. The stronger price will try to test the 29,000-32,500 area. If it can be passed, then bullishness may dominate further.
2. ConstitutionDAO (PEOPLE)

The bullish trend significantly impacted the price change of ConstitutionDAO (PEOPLE), where the price rallied more than 150%, indicating that positive momentum dominated the direction of the trend movement. When a correction occurs, the 1,450-1,600 area is quite an important area for ConstitutionDAO (PEOPLE).
3. JasmyCoin (JASMY)
 The movement of JasmyCoin (JASMY) is currently assumed by the MACD indicator to be in a negative area after the intersection of the downward line. Still, it has no significant impact on weakening the price. There is support in the 530-550 area; if this area is broken, the opportunity for correction is quite large.
4. Nexo (NEXO)

The formation of a candle with a complete shape above the 24,000-28,000 area is expected to allow Nexo (NEXO) to continue strengthening and head to the next level in the range of 30,000-36,000.
5. Ondo (ONDO)

Successfully strengthening and moving away from the WMA/85 made Ondo (ONDO) strengthen again following the ongoing bullish trend and made an All-Time High (ATH). The potential for Ondo (ONDO) to strengthen is quite wide open, with high price changes occurring. The closest support is available in the 19,000-21,000 area.
5 Bearish Crypto Assets
1. HedgeTrade (HEDG)
 The current trend identified by the MACD indicator needs more time to confirm the direction of the future trend movement. The candle holding above the WMA/85 could be one of the reinforcing factors, which should be determined by the 270-325 resistance area, which should be broken.
2. Multichain (MULTI)

The movement of the chart over 4 hours indicates that Multichain (MULTI) has been in the bearish zone since February 9, 2024, negatively affecting the price, which has fallen by more than 70%. The lowest price of Multichain (MULTI) will be formed if the 3,000 level is broken. The bearish trend will be stronger and dominate the price changes.
3. OctoFi (OCTO)

OctoFi (OCTO) is currently held back by the WMA/75 after previously the price was able to strengthen quite high, but was not supported by the resistance level of 7,100-9,000, which has not yet managed to form a candle. The possible weakness is trying to test the 4,400-5,200 support area. If this is broken, it will confirm the MACD indicator.
4. Degree Crypto Token (DCT)

There is no volatile price movement, making Degree Crypto Token (DCT) unable to confirm the direction of price movement. The MACD indicator indicates that the current bearish sideways phase has lasted long enough, with the closest support at 100,000-115,000.
5. Pando (PANDO)

The bearish trend still dominates the price changes. Pando (PANDO) did not manage to break from WMA/85. The MACD indicator will increasingly show if Pando (PANDO) is in a negative direction. If Pando (PANDO) cannot stay above the price of 15-20, it can also indicate that it will touch the lowest level during trading on INDODAX.
NOTES:
If EMA 5 crosses the WMA 75, 85, and EMA 200 lines, and these lines intersect from bottom to top, then the market trend tends to be upward (bullish).
Each table above shows that when the value of EMA 5 is higher than WMA 75,85 and EMA 200, the market tends to rise (bullish).
If the RSI and MACD values show the same condition, the market is showing the same trend; an overbought (overbought) or oversold (oversold) condition indicates that the market is at the point of changing trend direction.


 Polkadot 9.00%
 BNB 0.51%
 Solana 4.77%
 Ethereum 2.37%
 Cardano 1.58%
 Polygon Ecosystem Token 2.11%
 Tron 2.85%
 Market


