Starting in March 2024, Dogecoin (DOGE) finally rejoined the ranks of crypto assets on a bullish trend, followed by Bitcoin Gold (BTG) and Perpetual Protocol (PERP).
Curious about what crypto assets are experiencing bullish or bearish trends this week? Check out the full INDODAX Market Signal update below!
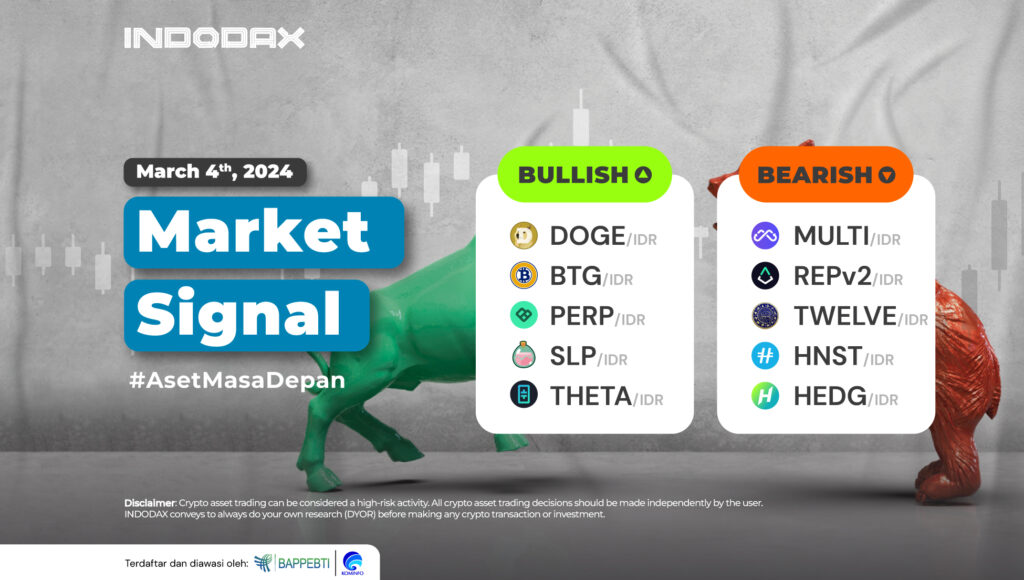
5 Bullish Crypto Assets
1. Dogecoin (DOGE)

Dogecoin (DOGE) rebounded quite high after a weak candle, but no more than the EMA/200 then, the Dogecoin (DOGE) price responded positively and impacted the 1,510-1,675 resistance passed. Dogecoin (DOGE) touched its highest price since 2022. The RSI indicator is currently indicating that Dogecoin (DOGE) is in an overbought area with weakness that, if it occurs, will test the 1,800-2,000 level.
2. Bitcoin Gold (BTG)

On the 1-day chart, Bitcoin Gold (BTG) continues to show price strengthening so that the bullish trend can continue. The 572,000-672,000 price area is one of the areas that is quite important for Bitcoin Gold (BTG). If a candle can be created above that area, then the potential for Bitcoin Gold (BTG) to strengthen is quite wide.
3. Perpetual Protocol (PERP)
 The trend is expected to move positively. The MACD indicator indicates this after the line was able to cut upwards. The uptrend will be determined by the price of Perpetual Protocol (PERP). If the price has not been able to break the 30,000-35,000 area, then it is assumed that the opportunity for Perpetual Protocol (PERP) to test the price of 15,000-20,000 is wide open.
4. Smooth Love Potion (SLP)

Since its first listing on INDODAX on August 26, 2021, which immediately touched the price range of 2,260, Smooth Love Potion (SLP) immediately weakened and was unable to correct the weakness that occurred until it touched the lowest price level of 20. The Smooth Love Potion (SLP) trend has turned bullish, which will test the 130-200 area.
5. THETA (THETA)

The price break of 20,000-25,000 made THETA (THETA) continue to strengthen and indicates that positive momentum can dominate the direction of trend movement. The nearest resistance area is available in the 40,000-52,000 area.
5 Bearish Crypto Assets
1. Multichain (MULTI)

The movement of the Multichain (MULTI) trend on the 1-Day chart is currently predicted to be in a bearish phase, with the trend still unable to move from the WMA/85. The bearish trend is assumed to be suppressed if the 12,000-17,000 area can be broken.
2. Augur v2 (REPv2)

The MACD indicator indicates the Augur v2 (REPv2) trend to be in a sideways phase with a price range of 11,000-20,000, where the EMA/200 will come under pressure if the sideways can end positively.
3. TWELVE ZODIAC (TWELVE)

The price weakness in TWELVE ZODIAC (TWELVE) will reach the support level of 28,000-34,000. If this level cannot withstand price weakness, it is assumed that the bearish trend will increasingly dominate the TWELVE ZODIAC (TWELVE) trend movement.
4. Honest (HNST)

Honest (HNST)’s bearish trend will be able to resume if a candle forms below the price of 70, which will make Honest (HNST) touch its lowest level. Conversely, a candle created above the 110-130 area will make the bearish phase fail to continue and switch to a new trend.
5. HedgeTrade (HEDG)

Although the MACD indicator showed a positive change in the HedgeTrade (HEDG) trend, the price did not strengthen significantly or sufficiently. The resistance level of 260-350, which has not been able to be passed, is one of the factors causing the slow strengthening of HedgeTrade (HEDG).
NOTES:
If EMA 5 crosses the WMA 75, 85, and EMA 200 lines, and these lines intersect from bottom to top, then the market trend tends to be upward (bullish).
Each table above shows that when the value of EMA 5 is higher than WMA 75,85 and EMA 200, the market tends to rise (bullish).
If the RSI and MACD values show the same condition, the market is showing the same trend; an overbought (overbought) or oversold (oversold) condition indicates that the market is at the point of changing trend direction.
 Market

