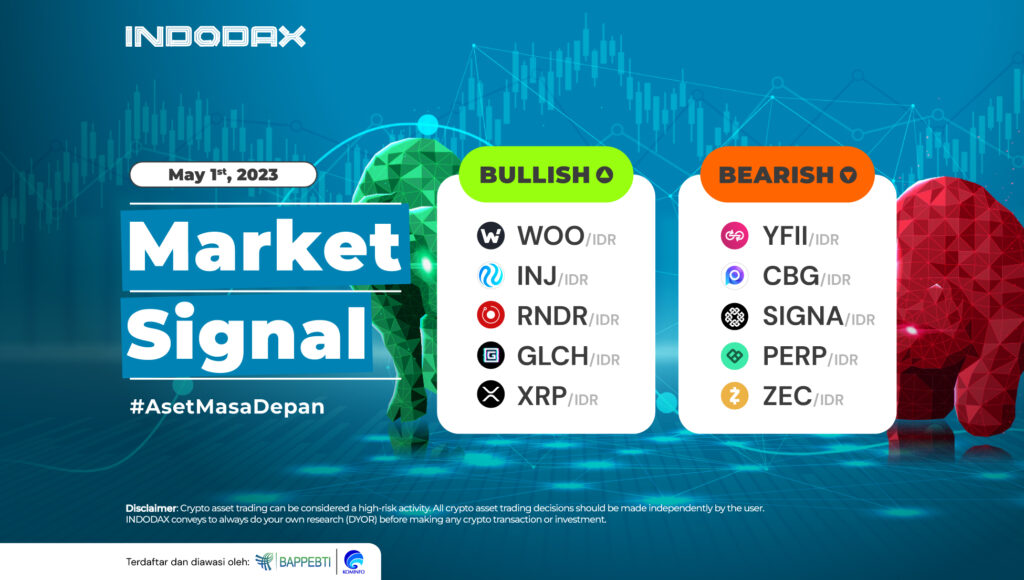
Hello INDODAX members, at the beginning of May 2023, WOO and INJ occupied the top positions of the bullish trend.
Check out the INDODAX market signal for more information about bullish and bearish crypto assets this week.
5 Bullish Crypto Assets
1. WOO Network (WOO)

After touching the level of 5,460, WOO experienced a correction. This can be seen from the MACD indicator, which has crossed downwards on the 1-day chart.
If the price weakens, it will try to test the 3.735 level. If it is passed, the support level is in the 3.000 – 3.150 area.
2. Injective (INJ)

It had weakened but failed to break EMA/200, then INJ strengthened quite high, up to around 120%.
The Bullish trend will get stronger if it can pass the Resistance level of 150,000 – 160,000.
3. Render Tokens (RNDR)

Render Token has been in the bullish zone since April 11, 2023.
The current RNDR trend is in the positive zone after the price could not pass the price of 30,000, so the price experienced a pullback and continued strengthening.
4. Glitch (GLCH)

Strengthening in GLCH has occurred since the trend was able to strengthen and move following the WMA/85 movement so that it was able to push the trend to enter an Uptrend.
The RSI indicator illustrates that the trend has moved from the Overbought area because the price has entered a correction, with support levels around 1.430 – 1.550.
5. Ripple (XRP)

XRP is currently experiencing weakness; the bullish trend will be further pressured if the candle moves weaker below WMA/75, which allows the candle to move towards the 6,300 – 6,500 area.
5 Bearish Crypto Assets
1. DFI.Money (YFII)

The Bearish phase has occurred since January 21, 2023, because the trend could not pass through the resistance area, which is quite strong in the 20,800,000 – 23,500,000 area.
On the contrary, if the area can be passed, the Bearish trend will be suppressed.
2. Chainbing (CBG)

CBG price continues to show weakness as several support levels cannot hold candles, such as 24,000 and 22,100 – 22,900.
The weakening will try to stay above the 19,000 – 19,500 area. If this level can be passed, Chainbing will be stronger in the Downtrend phase.
3. Signum (SIGNA)

SIGNA’s inability to stay above EMA/200 makes Signum unable to be in a bullish trend.
If you can break from the Resistance area 25 – 30, it will improve the Bearish trend.
4. Perpetual Protocol (PERP)

PERP experienced a correction because it was unable to stay above WMA/85.
The MACD indicator can draw a negative trend, but it will be corrected if it can pass the 14,000 level.
5. Zcash (ZEC)

The decline in ZEC has occurred quite deeply; after being in the Downtrend phase on May 16, 2022, Zcash has weakened by around 50%.
A bullish trend can occur if significant strengthening breaks several resistance levels, such as 660,000 – 720.00 and 800,000 – 950,000.
Note: If the EMA 5 crosses the WMA 75, 85, and EMA 200 lines and these lines intersect from the bottom up, then the market trend tends to be up (bullish); each table above shows if the EMA 5 value is higher than WMA 75, 85 and EMA 200, the market tends to rise (bullish).
Suppose the RSI and MACD values show the same condition. In that case, the market is showing the same trend. The condition is overbought (overbought) or oversold (oversold), which indicates that the market is at the point of changing the direction of the trend.
Attention: All content which includes text, analysis, predictions, images in the form of graphics or charts, as well as news published on this website, is only used as trading information and is not a suggestion or suggestion to take action in a transaction, either buying or selling certain crypto assets.
All crypto asset trading decisions are independent decisions by users. Therefore, all risks arising from it, both profit and loss, are not the responsibility of INDODAX.
 Market

