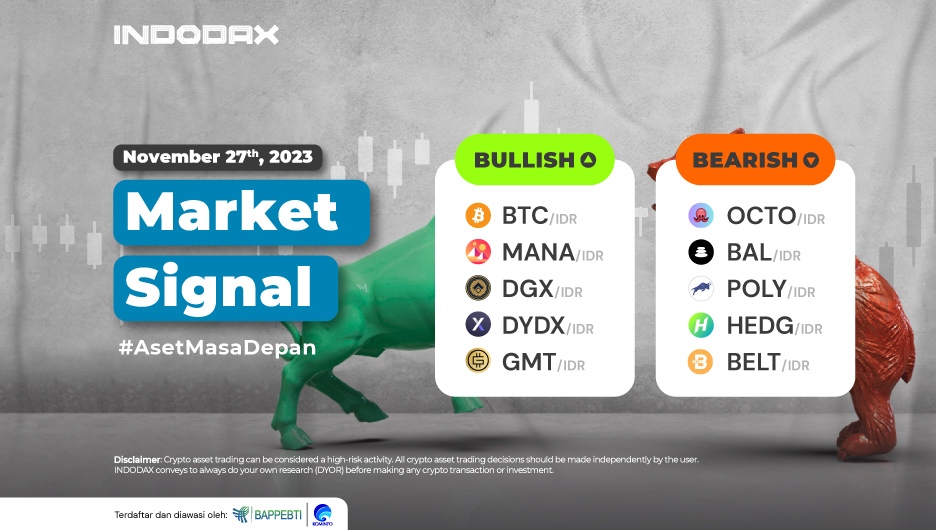
Leading the pack of bullish crypto assets, Bitcoin (BTC) and Decentraland (MANA) continued to move positively in the last week of November 2023.
Are you curious which crypto assets are experiencing bullish or bearish trends this week? Check out the complete INDODAX Market Signal update below!
5 Bullish Crypto Assets
1. Bitcoin (BTC)

The Bollinger Bands indicator indicates that the chances of Bitcoin (BTC) experiencing price changes are quite high, with an estimated movement of 530,000,000-600,000,000. One of the prices crossed will indicate a difference in the trend for Bitcoin (BTC).
2. Decentraland (MANA)

Decentraland (MANA) rebounded after failing to pass the support level at 5,600-5,800, so Decentraland (MANA) continued the ongoing bullish trend. The support level for Decentraland (MANA) is available in the 6,600-7,000 WMA/75 area, which will be under pressure if this area is successfully passed.
3. Digix Gold Token (DGX)

The Digix Gold Token (DGX) trend on the 1 Day chart continues to show weakness, but it is identified that the bullish trend is still running. The bullish trend will fail to continue if it cannot stay above the EMA/200. Then, this will be followed by a break in the support area in the range of 590,000-625,000.
4. dYdX (DYDX)

It is successfully in a bullish trend after breaking the sideways trend with a range of 28,000-35,000 positively impacted dYdX (DYDX) price changes. If dYdX (DYDX) can stay above the price of 44,000-47,000, it will strengthen the position that supports the MACD indicator.
5. STEPN (GMT)

STEPN (GMT) can continue to strengthen quite positively. This is inseparable from the trend that moves by the WMA/85 and can break resistance at 4,000-4,600. The bullish trend will become stronger and more dominant if the 5,800 level is crossed.
5 Bearish Crypto Assets
1. OctoFi (OCTO)

OctoFi (OCTO)’s weakness was massive. The trend had moved up to try to fix the weakness, but OctoFi (OCTO) moved the opposite way, where the trend could not cross the EMA/200 and made OctoFi (OCTO) weaken further. Weakness opportunities will open if the candle can’t form above 12,000, then the price is expected to reach 13,700.
2. Balancer (BAL)

Weakness in Balancer (BAL) will test support level 47,000-54,000. If this level is passed, Balancer (BAL) will certainly touch the lowest price since it was traded on INDODAX, and Balancer (BAL)’s negative momentum will be even more dominant in the 1-day trend.
3. Polymath (POLY)

Unable to survive in the 3,400-4,000 level area ensures Polymath (POLY) is in a new phase, namely a downtrend. If the candle can stay above the price of 2,600-3,000, then Polymath (POLY) can correct the price in the downtrend.
4. HedgeTrade (HEDG)

The trend that occurred, namely bearish, impacted the price of HedgeTrade (HEDG) and continued to weaken, followed by a trend that could not make a candle above EMA/200. The bearish trend of HedgeTrade (HEDG) will improve if the resistance level at 400-620 is overcome.
5. Belt Finance (BELT)

Candle is currently above the WMA/85, but the price of Belt Finance (BELT) has no positive change, and MACD indicates that the trend is in a negative zone. The trend is expected to be sideways bearish with a movement range of 1,040-1,500. A new price direction will be formed if this level can be broken.
NOTES:
If EMA 5 crosses the WMA 75, 85, and EMA 200 lines, and these lines intersect from bottom to top, then the market trend tends to be upward (bullish).
Each table above shows that when the value of EMA 5 is higher than WMA 75,85 and EMA 200, the market tends to rise (bullish).
If the RSI and MACD values show the same condition, the market is showing the same trend; an overbought (overbought) or oversold (oversold) condition indicates that the market is at the point of changing trend direction.


