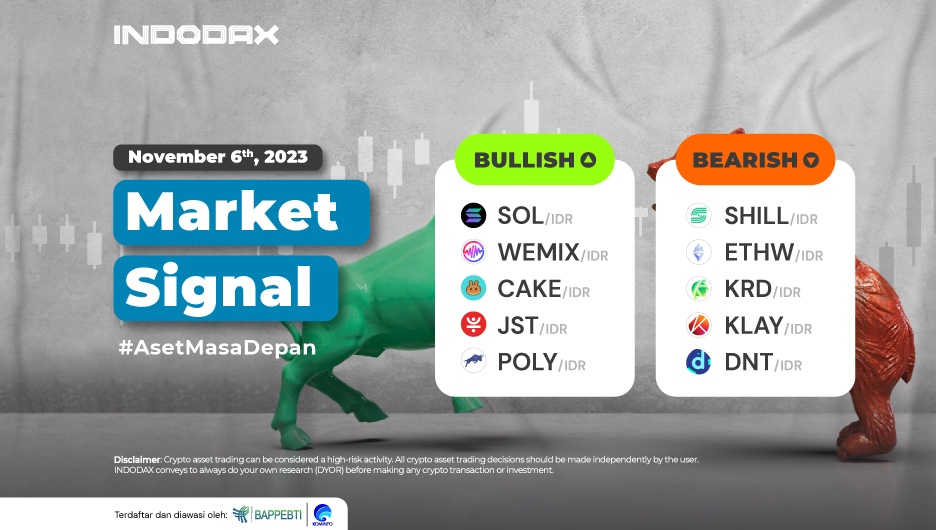
Crypto asset trends in the second week of November 2023 were marked by Solana (SOL), which was confirmed to be green, to Polymath (POLY), which is still in the bullish ranks.
Are you curious which crypto assets are experiencing bullish or bearish trends this week? Check out the complete INDODAX Market Signal update below!
5 Bullish Crypto Assets
1. Solana (SOL)

Strengthening in Solana (SOL) was initiated by a trend that could sustain above the 280,000 level, followed by the price moving above the EMA/200, causing several resistances to be broken, such as 385,000-400,000. This makes Solana (SOL) confirmed to be entering a bullish trend. The current price depicted by the RSI indicator is in the oversold area, so the potential for a trend correction is quite large, with the nearest support being around 605,000.
2. WEMIX (WEMIX)

It has been indicated that it has been in an uptrend since September 21, 2023. The price movement in the 4 hours experienced a sudden decline several times but stayed above the support of 12,400-11,800. Then, WEMIX (WEMIX) continued strengthening. If the candle can form above the price of 28,000, it will be quite positive for the movement of the WEMIX (WEMIX) trend.
3. PancakeSwap (CAKE)

After successfully passing the EMA/200, PancakeSwap (CAKE) experienced a fairly massive strengthening of up to around 80%. The MACD indicator indicates that PancakeSwap (CAKE) is in a positive direction, with the nearest resistance testing the level at 39,000-44,000.
4. JUST (JST)

On the 1 Day chart, JUST (JST) continues to show quite positive price changes, namely being able to penetrate the dominant resistance level in the 400-425 area. A positive signal will make JUST (JST) penetrate the 790 area level. If this level is capable of a new trend, then the indication of a bullish trend will be stronger.
5. Polymath (POLY)

The strengthening of the Polymath (POLY) price on the 1 Day chart cannot be separated from the trend, which succeeded in passing the sideways phase in the 1,800-2,600 range. By breaking through the resistance area, the price of Polymath (POLY) experienced a 70% increase. However, the price was unable to strengthen again. The RSI indicated that if the trend were in the overbought area, the price would test the strength of the 3,900-4,400 level area.
5 Bearish Crypto Assets
1. Shill Token (SHILL)

After strengthening, Shill Token (SHILL) was able to penetrate EMA/200, but this became a turning point for Shill Token (SHILL) to continue weakening because it could not form a candle above level 230. A bearish trend improvement will be created if WMA/85 can pass, so the potential to reach 120 is quite large.
2. EthereumPow (ETHW)

The trend movement of EthereumPow (ETHW) on 1-Day is depicted by the MACD indicator, which is positive. This is inseparable from price strengthening after breaking through WMA/85. The bearish trend will experience pressure if the price range of 25,000-35,000 is successfully penetrated so that positive momentum for EthereumPow (ETHW) will get better.
3. Krypton DAO (KRD)

It has been in the bearish zone since September 5, 2023, where, to date, Krypton DAO (KRD) has experienced a weakening of around 30%. This weakening is inseparable from the inability of Krypton DAO (KRD) to stay above EMA/200. The Bollinger Bands indicator shows that if the new trend narrows, this will not happen if the level 11,200-14,400 can be exceeded.
4. Klaytn (KLAY)

The bearish trend currently being experienced by Klaytn (KLAY) will be in danger of failing to continue if the price strengthening can continue. In contrast, if the 2,700-3,000 area can be penetrated, then the indication of the Klaytn (KLAY) trend passing through the EMA/200 will be quite large.
5. district0x (DNT)

A positive candle with a long shape is formed past the EMA/200, but the bearish district0x (DNT) trend will be confirmed to have failed to continue if the district0x (DNT) candle with a complete shape can form above the EMA/200, then the 700 level is successfully passed.
NOTES:
If EMA 5 crosses the WMA 75, 85, and EMA 200 lines, and these lines intersect from bottom to top, then the market trend tends to be upward (bullish).
Each table above shows that when the value of EMA 5 is higher than WMA 75,85 and EMA 200, the market tends to rise (bullish).
If the RSI and MACD values show the same condition, the market is showing the same trend; an overbought (overbought) or oversold (oversold) condition indicates that the market is at the point of changing trend direction.


