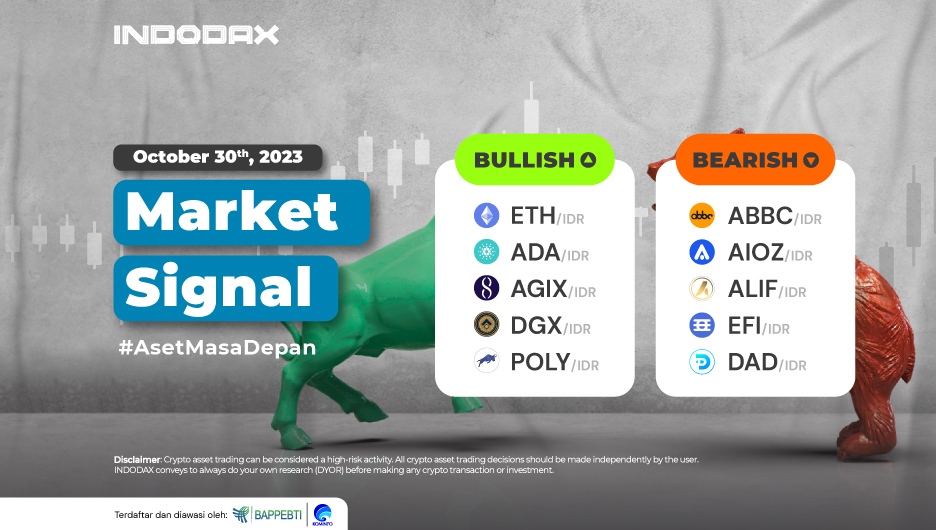
Starting from Ethereum (ETH), which entered a bullish phase, to Cardano (ADA), which strengthened by more than 15%, here are the crypto asset trends at the end of October 2023.
Are you curious which crypto assets are experiencing bullish or bearish trends this week? Check out the complete INDODAX Market Signal update below!
5 Bullish Crypto Assets
1. Ethereum (ETH)

Ethereum (ETH) is in a positive zone, which cannot be separated from Ethereum (ETH) entering a bullish phase. In a trend that is experiencing sideways on the 4-hour chart with a range of 28,000,000-29,500,000, the latest level will be formed if one of these levels is exceeded and will impact the Bollinger Bands, which will become more volatile.
2. Cardano (ADA)

Being in a bullish trend since October 24, 2023, has resulted in the price of Cardano (ADA) strengthening by more than 15%. A dynamic increase in price will make the trend move quite positively, allowing the price to pass through the available resistance levels, such as at 4,800-5,000.
3. SingularityNET (AGIX)

The price movement of SingularityNET (AGIX) in the 4-hour timeframe is very positive, where the price continues to strengthen in line with the trend of EMA/5 and WMA/75. This will open up opportunities for SingularityNET (AGIX) to penetrate the resistance area, which is quite dominant in the price range of 4,700-5,200.
4. Digix Gold Token (DGX)

The price of Digix Gold Token (DGX) moved from WMA/85, indicating that positive momentum is sufficient to support price changes. Digix Gold Token (DGX) price is trying to hold above WMA/85, with the nearest resistance being at the 900,000 level.
5. Polymath (POLY)

The success of Polymath (POLY) to end the sideways phase of 1,800-2,220 with resistance being passed ensures Polymath (POLY) enters an uptrend. If the trend continues to strengthen until it breaks from the 5,500-6,000 resistance zone, it will make the Polymath (POLY) bullish trend strong.
5 Bearish Crypto Assets
1. ABBC Coin (ABBC)

ABBC Coin (ABBC) experienced price weakness, where since it was in the downtrend phase on July 16, 2023, ABBC Coin (ABBC) has experienced a weakening of around 50%. The current trend of ABBC Coin (ABBC) using the MACD indicator is positive. Still, it has no impact on the price of ABBC Coin (ABBC) because the candle is not moving dynamically enough and has not succeeded in moving above WMA/75.
2. AIOZ Network (AIOZ)

AIOZ Network (AIOZ) price is above the WMA/85 line, and the MACD indicator shows positive changes. However, this must be followed by a successful candle to pass the 280-370 resistance with the subsequent target towards EMA/200.
3. ALIF (ALIF)

The bearish trend that has occurred since June 3, 2023, has caused the price of ALIF (ALIF) to weaken by around 90%, namely touching the price of 6.60, which is the lowest price for ALIF (ALIF) since it was traded on INDODAX. The price of ALIF (ALIF) can be corrected if the candle must move from WMA/85; then, the trend can move above the price of 20,000.
4. Efinity Token (EFI)

The bearish trend will experience pressure if the Efinity Token (EFI) price moves past the EMA/200 and the area at the 1,050-1,400 level can be penetrated, where the MACD indicator will become increasingly positive, showing the trend occurring in Efinity Token (EFI).
5. DAD (DAD)

It penetrated the EMA/85, but this strengthening was only temporary after the RSI indicator indicated that the DAD (DAD) price was already in the overbought area. Hence, the price was unable to continue strengthening again. DAD (DAD) weakness is stuck at the support level of 150-135. If it cannot survive above this level, then DAD (DAD) will touch its lowest level.
NOTES:
If EMA 5 crosses the WMA 75, 85, and EMA 200 lines, and these lines intersect from bottom to top, then the market trend tends to be upward (bullish).
Each table above shows that when the value of EMA 5 is higher than WMA 75,85 and EMA 200, the market tends to rise (bullish).
If the RSI and MACD values show the same condition, the market is showing the same trend; an overbought (overbought) or oversold (oversold) condition indicates that the market is at the point of changing trend direction.


