In the second week of October 2023, there will be an interesting surprise for loyal INDODAX crypto traders!
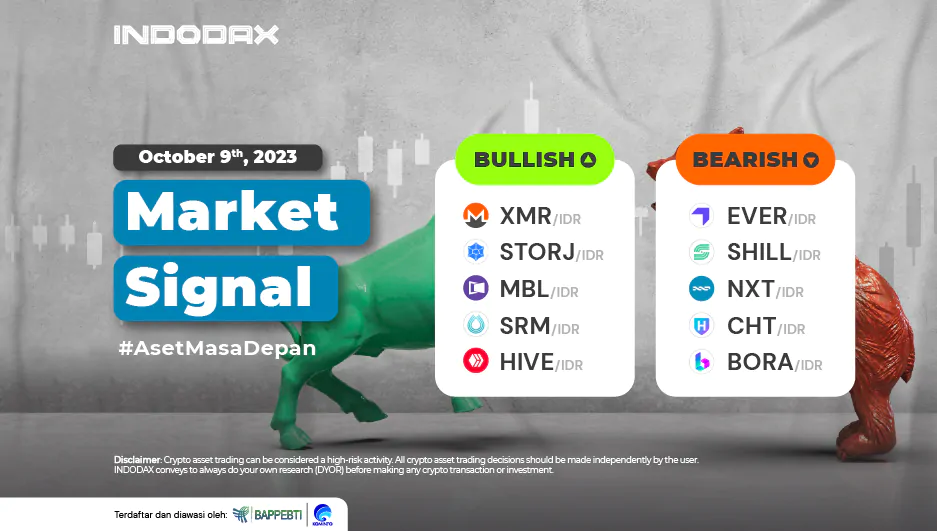
Because the crypto asset Monero (XMR) coin occupies the top position among bullish crypto assets, followed by the STORJ token in the second position.
Curious about what crypto assets are experiencing a bullish or net trend? Let’s discuss it in full in the latest INDODAX market signal below.
5 Bullish Crypto Sssets
1. Monero (XMR) Coin

The XMR price in the 4-hour movement has shown that the current trend has touched the overbought zone on the RSI indicator, an indication that the price will experience pressure. If XMR is able to form a candle above the 2,430,000–2,500,000 zone, a new direction will be formed for Monero in the bullish phase.
2. Storj (STORJ) Token

The bullish trend on STORJ in the 4-hour time frame is getting stronger. After the correction that occurred remained above the support level of 6,270–6,800, the price of STORJ (STROJ to IDR) continued strengthening again in line with the current trend.
3. MovieBloc (MBL) Coin

It has been in a bullish phase since September 23, 2023, when the price experienced a correction but was held back by the EMA/200, creating positive momentum that pushed the price of MovieBloc (MBL to IDR) to continue strengthening. The strengthening that occurs will provide an indication of heading to the 52–56 area.
4. Serum (SRM) Coin

Success in penetrating and remaining above WMA/85 is an indication that the SRM to IDR price will switch to a new trend from bearish to bullish, confirmed by the break of Resistance 640–675, causing the price to strengthen.
5. HIVE (HIVE) Coin
The MACD indicator still shows that the trend has not been confirmed and requires further time to confirm price movements. The bullish trend will be stronger and continue if the 5,000–5,500 area can be passed with the next resistance at the Hive price of 6,000–6,400.
5. HIVE (HIVE) Coin

The MACD indicator still shows that the trend has not been confirmed and requires further time to confirm price movements. The bullish trend will become stronger and continue if the 5,000 – 5,500 area can be passed with the next resistance at the Hive price of 6,000 – 6,400.
5 Bearish Crypto Assets
1. Everscale (EVER) Coin

It crossed the EMA/200 and formed a fairly strong positive candle, but the Everscale price weakened and returned to its original price, so the trend was unable to increase. The indicated support area available is around 520–570; if the price is unable to stay above this level, then the bearish trend will get stronger.
2. Shill (SHILL) Token

The decline in Shill token prices has been quite deep, but the MACD indicator also shows that the trend is in a negative area. The support area that dominates is around 100; passing this level will indicate that SHILL has touched its lowest price.
3. NXT (NXT) Coin

The trend shown by the MACD indicator is in a positive direction; however, the strengthening of the NXT price is not very significant because the price is still predominantly moving in the sideways zone with a price range of 18–23.
4. CyberHarbor (CHT) Coin

The downtrend currently occurring on CyberHarbor on the 1-day chart will fail to continue the direction of the CyberHarbor price movement in the next trend if the candle is able to break at WMA/85, followed by a break in the 360,000–435,000 area.
5. BORA (BORA) Coin

The BORA price movement in the 1-day time frame continues to weaken because supply pressure dominates over demand, impacting the BORA trend, which cannot be separated from negative momentum. The indicated support area is around 1,530–1,640; if the price is unable to stay above this level, then the bearish trend will get stronger.
So, that’s the information regarding the latest market signal updates in the second week of October 2023.
You can also take advantage of the newest feature from Indodax, called crypto staking, to support the success of your crypto investment. See you in the market signal update next week, and I hope this information is useful.
NOTE: If EMA 5 crosses the WMA 75, 85, and EMA 200 lines and these lines intersect from bottom to top, then the market trend tends to be upward (bullish).
Each table above shows that if the EMA 5 value is higher than the WMA 75.85 and EMA 200, then the market tends to rise (bullish).
If the RSI and MACD values show the same condition, it means that the market is showing the same trend. An overbought (overbought) or oversold (oversold) condition is an indicator that the market is at the point of changing trend direction.
Attention: All content, which includes text, analysis, predictions, images in the form of graphics or charts, as well as news published on this website, is only used as trading information and is not a recommendation to take action in transactions, whether buying or selling certain crypto assets.
All crypto asset trading decisions are independent decisions by the user. Therefore, all risks arising from it, whether profit or loss, are not guaranteed.
 Market