
Do you already know what Harmonic Patterns are? If not, or even if you want to learn more, let’s learn together about Harmonic Patterns in the following article!
What are Harmonic Patterns?

Harmonic patterns are price chart patterns that can be used to predict future price movements.
Another definition, namely a pattern, states that the price trend of crypto assets is a harmonic phenomenon.
Using the Fibonacci sequence, which is further divided into larger or smaller ratios, this pattern is used to predict the path of price movements.
Harmonic patterns in crypto trading combine Fibonacci extensions and reversals to produce five dot patterns on the chart.
The five dot patterns with a special ratio will form various types of patterns harmoniously.
Having a higher success rate than other price movement patterns, harmonic patterns can also help traders determine asset price reversals.
Types of Harmonic Patterns
In the harmonic pattern, there are 4 components, namely ABCD, which include:
- AB and CD are the legs (legs)
- The BC line is a correction (retracement)
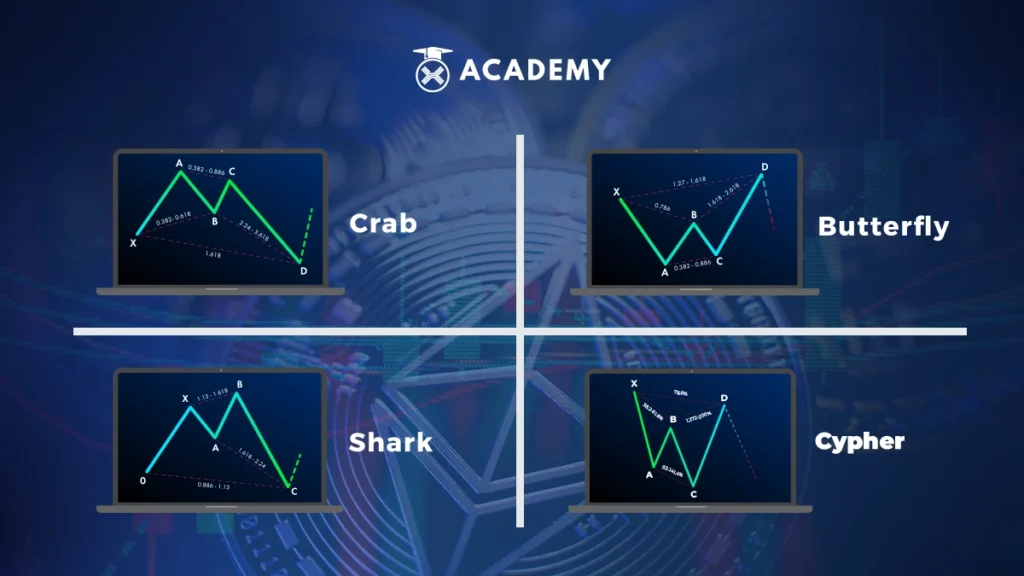
Meanwhile, the type or type of harmonic pattern is divided into crab, butterfly, shark, and cypher patterns. The following is an explanation of each type.
1. Crabs pattern
With a shape that resembles a crab, the crab pattern is a harmonic pattern with high accuracy.
This pattern can explain price reversal information in a very close timeframe to the results of Fibonacci predictions.
2. Butterfly pattern
Bryce Gilmore was the first to suggest this pattern. He applies a mix of different Fibonacci ratios to analyze price reversal opportunities.
In terms of structure, the butterfly pattern has four legs, namely XA, AB, BC, and CD. The distance between points A and X is 0.768.
Butterfly harmonics are also able to help traders to be able to analyze point B with the Potential Reversal Zone or PRZ. Later, this will show the price level when the trader opens a position.
3. Shark pattern
The following harmonic patterns have highs and lows that consistently surpass the previous peaks and valleys.
In the harmonic shark pattern, the accuracy serves to identify key resistance/support levels from point 0 to point C.
4. Cypher pattern
This harmonic pattern is a pattern that will help investors to take advantage of forex strategies to provide profit.
When it is part of a large geometric pattern group, the cipher pattern will offer the highest win rate than any other harmonic pattern.
Disadvantages of Harmonic Patterns
Although it is very helpful for traders, this pattern still has various drawbacks, including the following.
1. Have many kinds of patterns
Harmonic patterns have about six types of patterns, all requiring great care and accuracy to analyze.
Besides that, each type of Harmonic also has a similar shape, so many traders often need clarification.
2. Requires high expertise
Using this harmonic pattern will require high experience and expertise because it will involve calculating Fibonacci ratios.
According to many traders, calculating Fibonacci ratios is a difficult thing. If there is a miscalculation, then it can result in an analysis error.
3. Only suitable for swing traders
Finally, it is known that this pattern only relies on the ratio between price changes without calculating the time frame needed to reach a certain pattern.
Therefore, this pattern is only suitable for swing traders rather than day traders.
Advantages of Harmonic Patterns
So, why do traders prefer this pattern? Here are some of the advantages.
1. Help predict prices more accurately
This pattern will help predict future price movements more accurately than other patterns.
Thus, traders can correctly determine to buy/sell entry opportunities. In addition, the profit obtained will also be far more optimal.
2. Be objective
This pattern measures Fibonacci ratios so traders can use mathematical numbers to make predictions.
So, the analysis results are more objective and can provide more accurate results than patterns that are assumptions.
3. Easy to analyze
This pattern is usually very easy to analyze. If you are used to using this pattern, traders can identify this pattern without needing the help of indicators or measuring Fibonacci ratios.
How to Use Harmonic Patterns

According to experts, how to use harmonic patterns in trading is as follows.
1. Harmonic Pattern Indicator Bearish and Bullish
The bullish harmonic pattern will explain the possibility of a price increase in the market.
When traders find this pattern, they usually defend their assets and sell them later when the price has reached the profit target.
On the other hand, a bearish harmonic pattern signals the possibility of a price decline in the market.
When traders see this bearish pattern, they usually sell their assets to avoid higher losses.
2. Entries and Stop Loss
In harmonic patterns, entry and stop loss indicators provide an overview of the validity of this pattern and show actual market conditions.
With these two indicators, traders can place a PRZ point when a price reversal occurs and can also position a stop loss below the long entry or above the short entry.
The PRZ (Potential Reversal Zone) point is where the price may reverse after reaching a certain level.
3. Harmonic Pattern Projection Distance
Suppose the projected harmonic pattern occurs on a price chart with a narrow timeframe and is similar to conditions in the real market. In that case, traders can choose to open/close positions according to the shape of the pattern.
However, on the other hand, if the projection has a timeframe that tends to widen on the price chart, traders should reconfirm price movements through other indicators before deciding to take a position.
Conclusion
The harmonic pattern is a price chart pattern that can be used to predict future price movements.
Combining Fibonacci extensions and reversals, harmonic patterns in crypto trading generate five dot patterns on the charts.
With a higher success rate than other price movement patterns, it can also help traders determine asset price reversals.
This pattern has four components, namely ABCD. Meanwhile, the types are divided into crab, butterfly, shark, and cypher patterns.
Apart from using harmonic pattern techniques, it turns out that there are still patterns that you can use to maximize your trading activities, for example, divergence patterns and flag patterns.
If you’re curious, you can learn various pattern techniques to help your trading only at INDODAX Academy.
 Market

