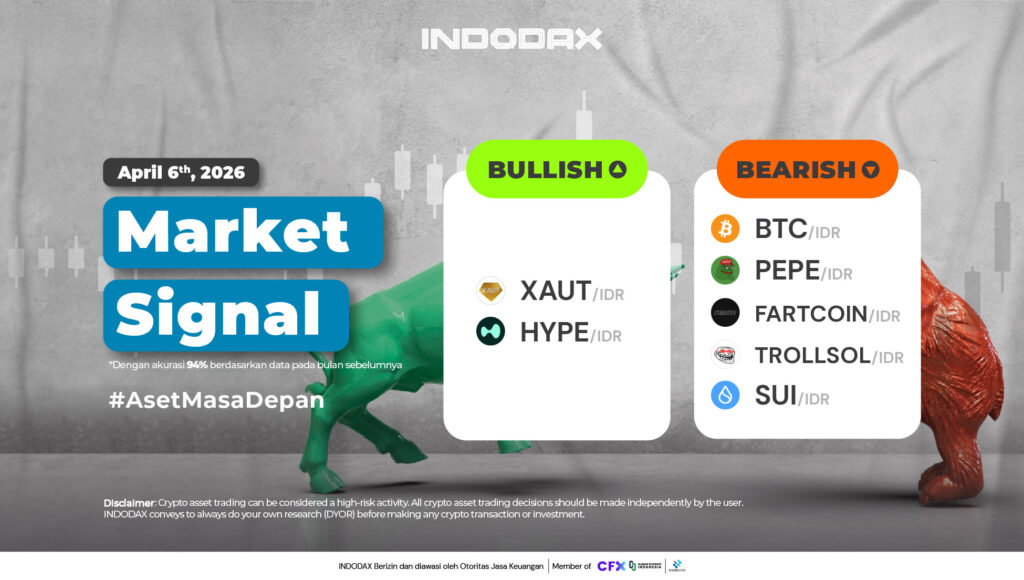
This week, the bullish crypto lineup is led by Tether Gold (XAUT) in first place, followed by Hyperliquid (HYPE).
Want to know how your favorite crypto asset is performing? Check INDODAX Market Signal below!
2 Bullish Crypto Assets
1.Tether Gold (XAUT)
The MACD indicator shows a positive change, as the price of Tether Gold (XAUT) remains above the EMA/200.
2.Hyperliquid (HYPE)
The bullish phase is still forming in the Hyperliquid (HYPE) trend movement, strengthening is trying to break through the 70,000 – 78,000 level.
5 Aset Kripto Bearish
1.Bitcoin (BTC)
Bitcoin (BTC) is expected to move more dynamically and positively with the Candle remaining above the 1,300,000,000 – 1,450,000,000 area.
2.Pepe (PEPE)
On the 4-Hour Chart, it is indicated that Pepe (PEPE) has been in a Bearish phase since January 26, 2026. The weakening has been ongoing for more than 34%, with the current trend still trying to break through the WMA/85.
3.Fartcoin (FARTCOIN)
Support is in the range of 1,800 – 2,200, which is quite an important price for Fartcoin (FARTCOIN). If it is broken, the lowest price will be formed.
4.TROLL (SOL) (TROLLSOL)
Still moving below the WMA/75, overall TROLL (SOL) (TROLLSOL) is indicated to be in a Bearish phase since October 11, 2025. The weakening can be corrected by strengthening the trend above the 220-260 area.
5.Sui (SUI)
22,000 – 35,000 is an important price for SUI, the Bearish trend will be suppressed if this price is broken and becomes one of the price strengthening.
NOTE: If the 5 EMA crosses the WMA 75, 85 and 200 EMA lines and the lines intersect from the bottom up, then the market trend tends to go up (bullish), each table above shows that if the 5 EMA value is higher than the 75.85 WMA and 200 EMA, the market tends to go up (bullish).
If the RSI and MACD values ??show the same condition, it means that the market is showing the same trend. Overbought or oversold conditions are an indicator that the market is already at the point of changing direction of a trend.
ATTENTION: All contents which includes text, analysis, predictions, images in the form of graphics and charts, as well as news published on this website, is only used as trading information, and is not a recommendation or suggestion to take action in transacting either buying or selling. certain crypto assets. All crypto asset trading decisions are independent decisions by the users. Therefore, all risks arising from it, both profit and loss, are not the responsibility of Indodax.
 Market