
Indodax.Academy will discuss 5 bullish and bearish crypto assets for the next week, 23 November 2020 – 29 November 2020 on indodax Market. Not only that, crypto assets that are on a downtrend or worth selling will also be discussed in this article.
If we look at the previous week’s movement, crypto assets are still on a bullish trend. This is certainly good news for those of you who hold superior crypto-assets such as Bitcoin, Ethereum (ETH), and others.
5 Crypto Assets With Bullish Trend This Week
- Bitcoin (BTC)
Bitcoin is one of the 5 bullish crypto assets this week. The price of the crypto asset with the largest valuation in the world is predicted to increase over the next week. Bitcoin is still holding its highest price.
One that can stimulate Bitcoin price predicted to increase over the next week is due to the massive purchase of Bitcoin by several giant companies in the United States (US). This is done in protecting their assets.
The uncertainty of US policy after the presidential election made many people secure their assets in Bitcoin. Not only that, the Paypal factor is also still a support that makes Bitcoin prices go up.

Chart Bitcoin / IDR
In last week, BTC moved at the lowest level of IDR 251,373,000 and the highest level was IDR 263,864,000. BTC entered into 5 bullish crypto assets this week.
Here’s BTC technical analysis this week:
| EMA 5 | 216,601,008 | buy |
| WMA 75 | 180,799,917 | buy |
| WMA 85 | 178,958,296 | buy |
| EMA 200 | 157,440,859 | buy |
| RSI (15) | 73.6792 | buy |
| MACD 12.26 | 17236702 | Buy |
| Summary | BUY |
- Ethereum (ETH)
The second most popular crypto asset and being the 5th most bullish crypto asset this week is Ethereum. One of the reasons is in the near future Ethereum will evolve into Ethereum 2.0.
This evolution will give rise the ETH price, and the demand for Ether (ETH) will increase dramatically. Ethereum 2.0 will enlarge its network and turn into a proof of staking (PoS) algorithm from the original PoW (Proof of Work) scheme.
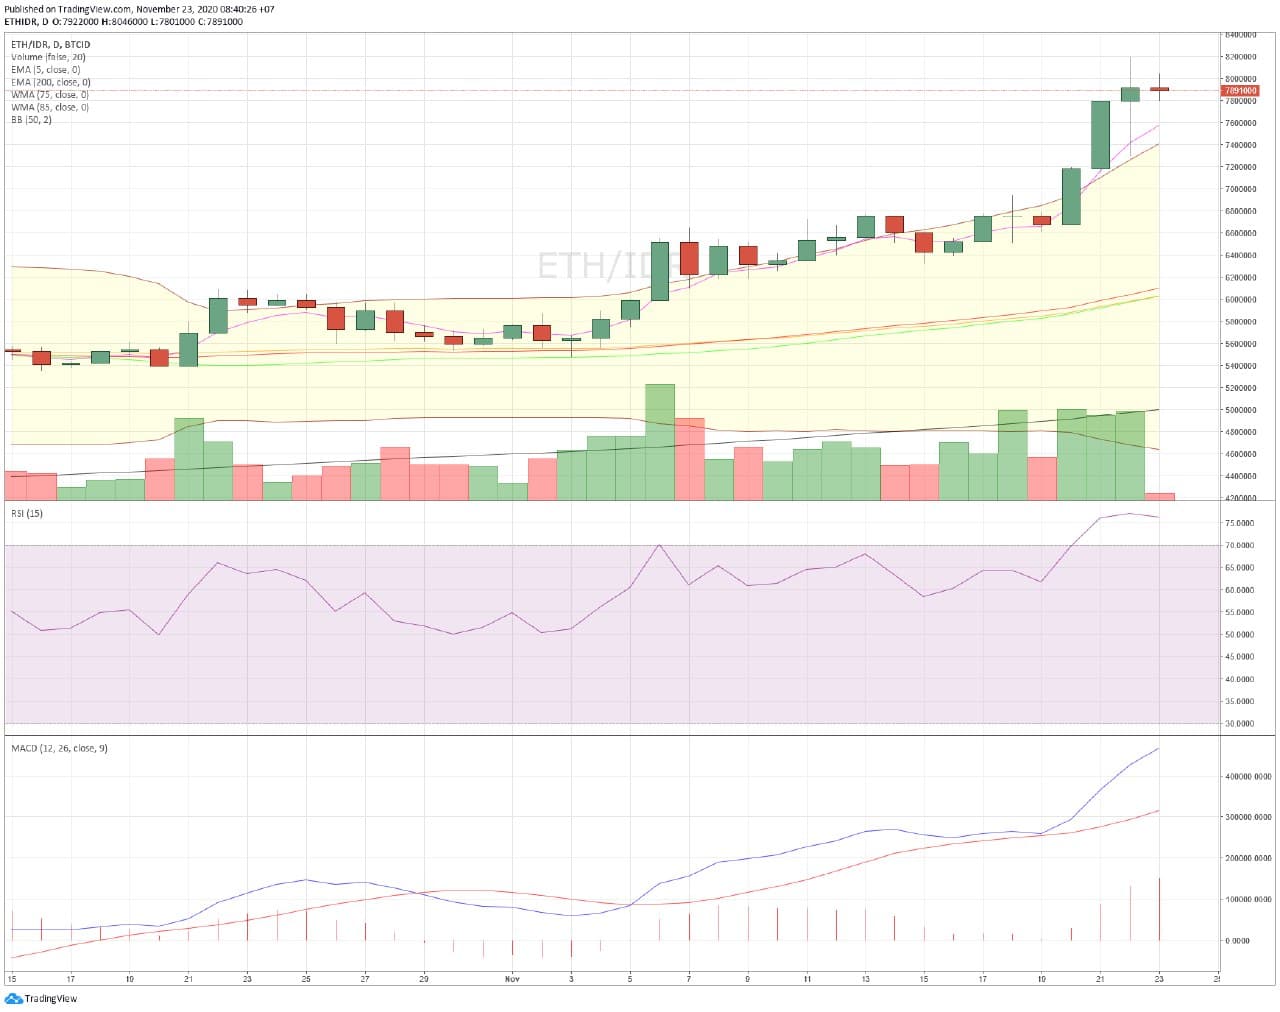
Chart ETH / IDR
Last week, ETH moved at the lowest level of IDR 7,300,000 and the highest level was IDR 8,200,000. ETH entered into 5 bullish crypto assets this week.
Here’s the ETH technical analysis this week:
| EMA 5 | 7,572,887 | buy |
| WMA 75 | 6,098,123 | buy |
| WMA 85 | 6,029,118 | buy |
| MA 200 | 5,002,301 | buy |
| RSI (15) | 76.3148 | overbought |
| MACD 12.26 | 468073.0655 | buy |
| Summary | BUY (5) Overbought (1) |
- Chainlink (LINK)
The next token to be the 5 bullish crypto assets this week is Chainlink (LINK). LINK is one of the tokens used in the DeFi ecosystem, which is currently loved by crypto lovers.
The news of Ethereum evolving into Ethereum 2.0 provides a breath of fresh air to DeFi tokens within the Ethereum ecosystem. LINKis one of the DeFi tokens that is experiencing trend bullish along with the increasing price of Ethereum tokens.

Chart LINK / IDR
In last week’s trading, LINK moved at the lowest level of Rp196,366 and the highest level was Rp213,942. LINK has entered into 5 bullish crypto assets this week.
The following technical analysis this week LINK:
| EMA 5 | 178.557 | buy |
| WMA75 | 133.465 | buy |
| 85WMA | 161.904 | buy |
| 200 EMA | 161.717 | buy |
| RSI (15) | 58.3867 | buy |
| 12.26MACD | 10344.3721 | buy |
| Summary | BUY | |
- Stellar Lumens (XLM)
The next coin to be the 5 bullish crypto assets this week is Stellar Lumens (XLM). Stellar Lumens (XLM) CEO Denelle Lixon attended a meeting with the IMF in October 2020.
The meeting, which was attended by Mastercard officials, is expected to have a good impact on the future of XML. XLM is a crypto asset that is quite popular and has strong fundamentals and utility.
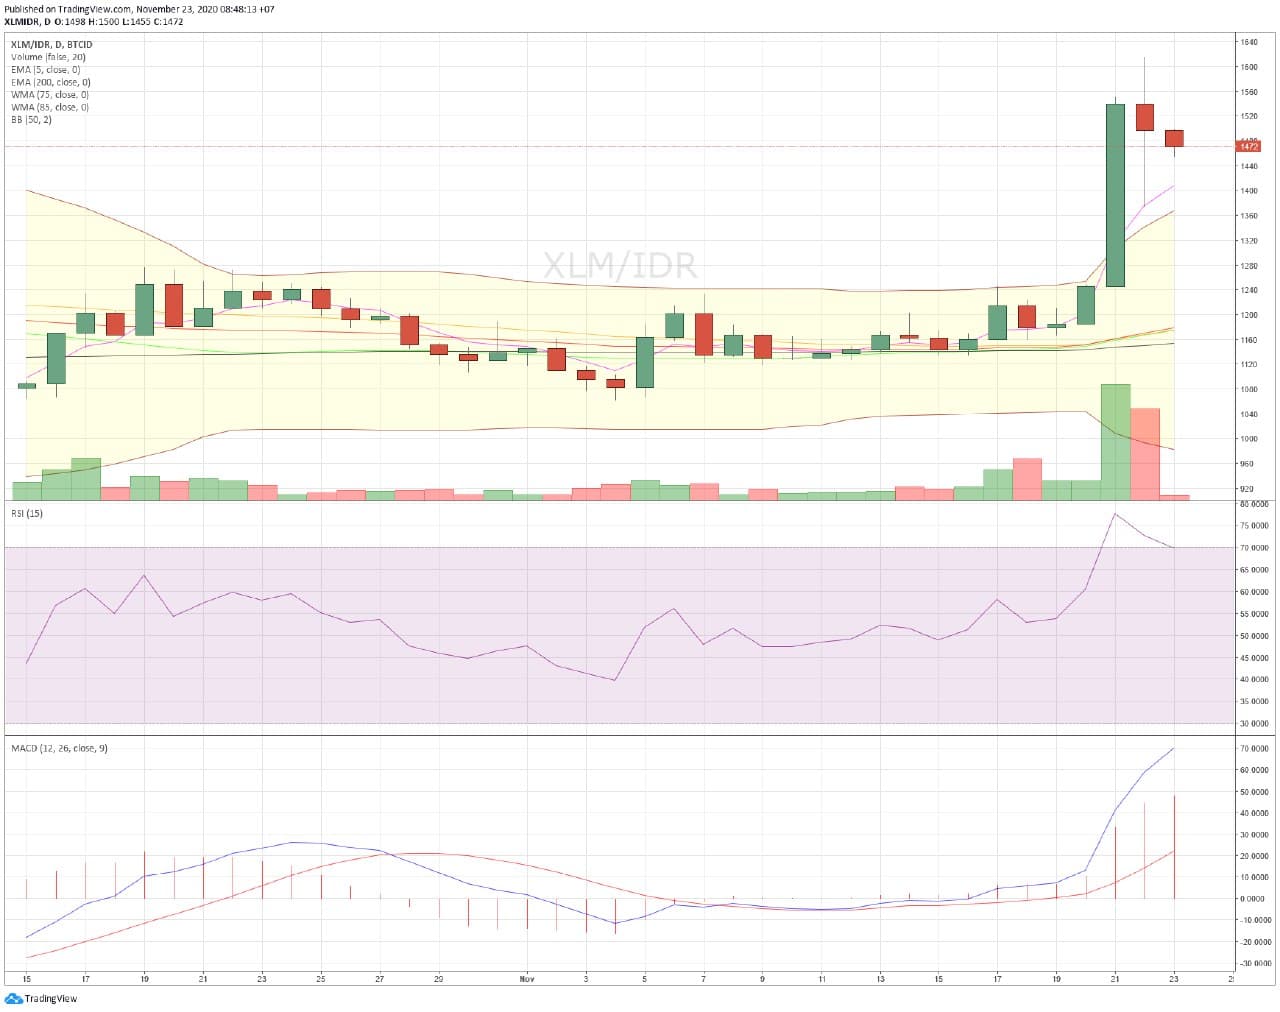
XLM / IDR Chart
In last week’s trading, XLM moved at the lowest level of IDR1375 and the highest level was IDR1559. XLM entered into 5 bullish crypto assets this week.
Following is the XLM technical analysis for this week.
| EMA 5 | 1,314 | buy |
| WMA 75 | 1,161 | buy |
| WMA 85 | 1,160 | buy |
| EMA 200 | 1,147 | buy |
| RSI (15) | 77.7689 | buy |
| MACD | 12,26 71.5731 | buy |
| Summary | BUY |
- Ripple (XRP)
The next coin to make the 5 bullish crypto assets this week is Ripple (XRP). Ripple did buyback SD 46 million worth of XRP or the equivalent of Rp.464 billion last week.
This is done to create a healthy climate for the XRP cycle. This buyback is the first time it has been carried out, to be precise in the third quarter of 2020. Even though Ripple itself already has almost half of the circulating XRP supply.
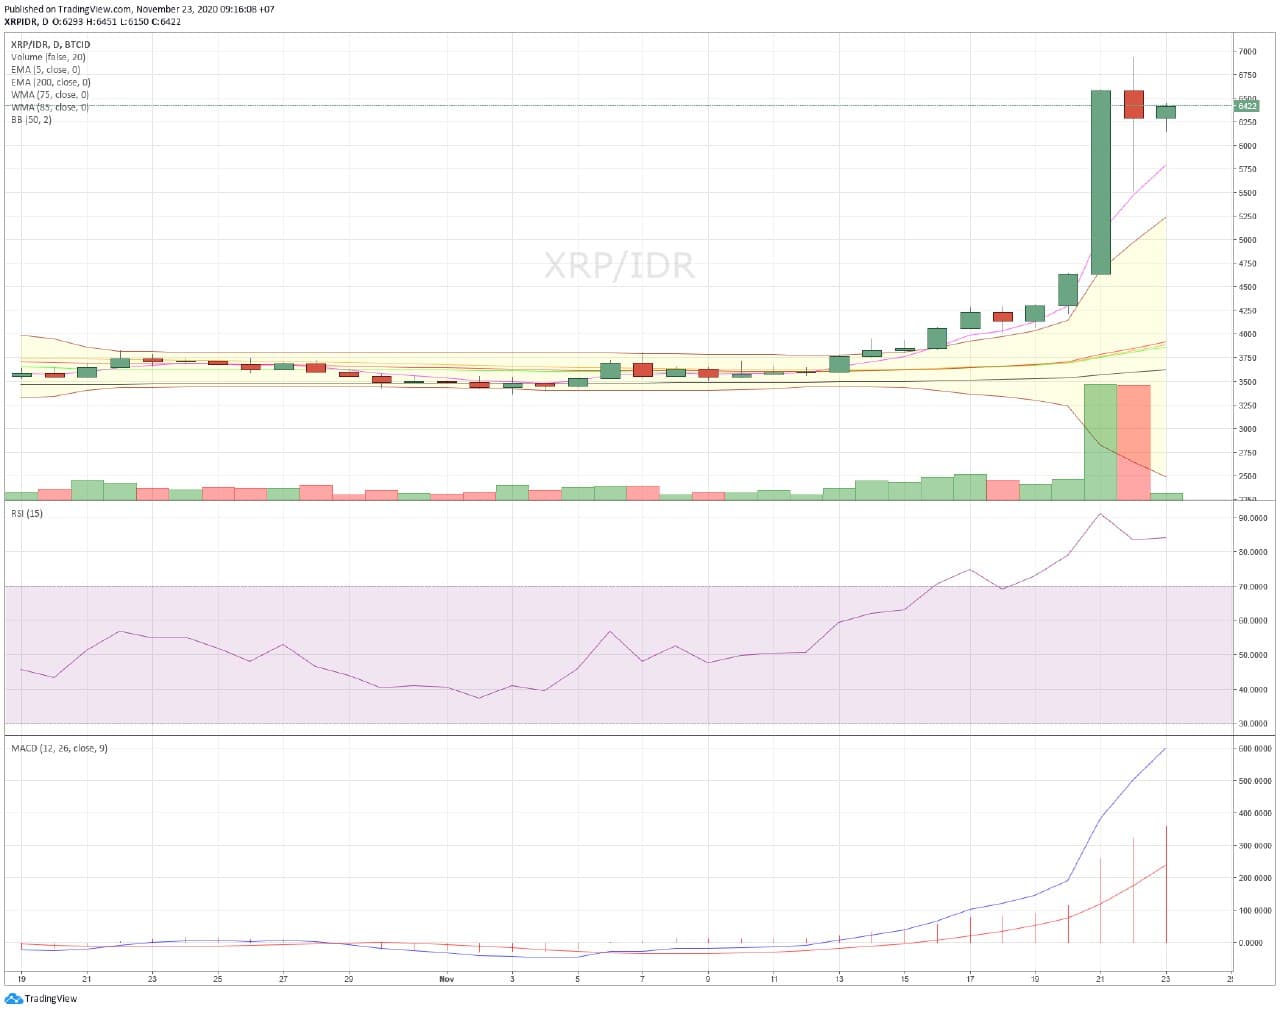
XRP / IDR Chart
In trading last week, XRP moved at the lowest level of IDR5,780 and the highest level was IDR6780. XRP entered into 5 bullish crypto assets this week.
Here’s the XRP technical analysis for this week:
| EMA 5 | 5,470 | buy |
| WMA 75 | 3,849 | buy |
| WMA 85 | 3,824 | buy |
| EMA 200 | 3,595 | buy |
| RSI (15) | 83.4814 | overbought |
| MACD | 12,26 600.0855 | buy |
| Summary | BUY (5) Overbought (1) |
Here Are 5 Crypto Assets That Are Bearish This Week
- Tether (USDT)
Tether (USDT) entered into 5 bearish crypto assets this week. USDT is very influential on the policies of the United States Government (US). This is because the USDT price adopts the US dollar (USD) currency.
After the US Presidential election, the country’s economy experienced a slight decline. This is why the USDT price has also decreased.
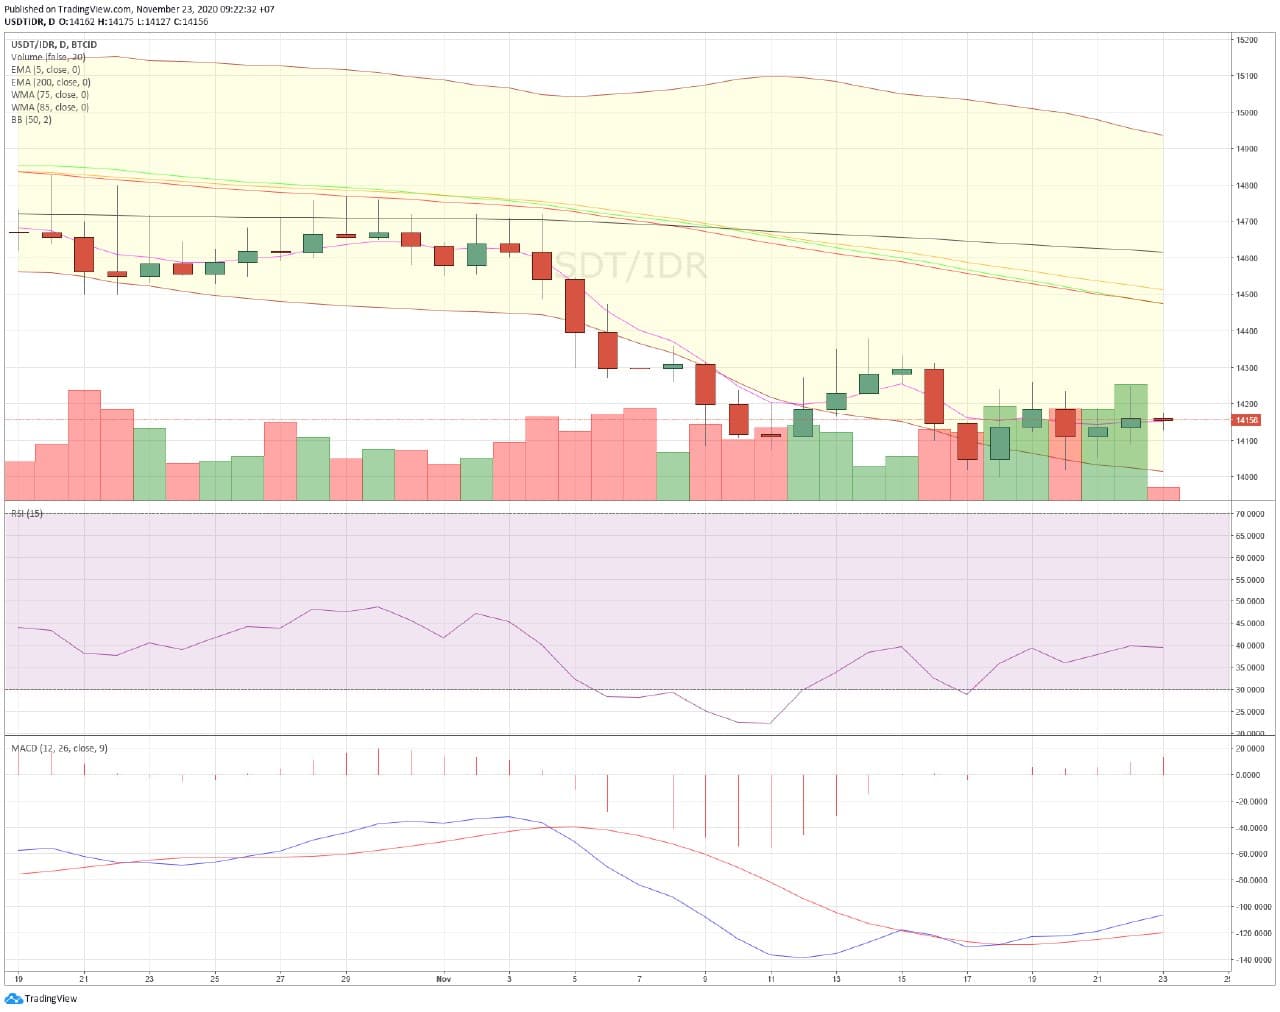
Chart USDT / IDR
In trading last week, USDT moved at the lowest level of IDR14,111 and the highest level was IDR14,250.
Here’s the technical analysis for this week:
| EMA 5 | USDT14,151 | sell |
| WMA 75 | 14,475 | sell |
| WMA 85 | 14,513 | sell |
| EMA 200 | 14,616 | sell |
| RSI (15) | 39.4355 | neutral |
| MACD 12.26 | -106.6675 | oversold |
| Summary | SELL (4) Neutral (1) Oversold (1) | |
| Bearish |
- ZCoin (XZC)
Zcoin or XZC entered into the 5 bearish crypto assets this week. XZC has decreased this week.
This coin has not been able to move up and has not been able to innovate so that it is predicted that the price will enter a bearish trend for the next week.
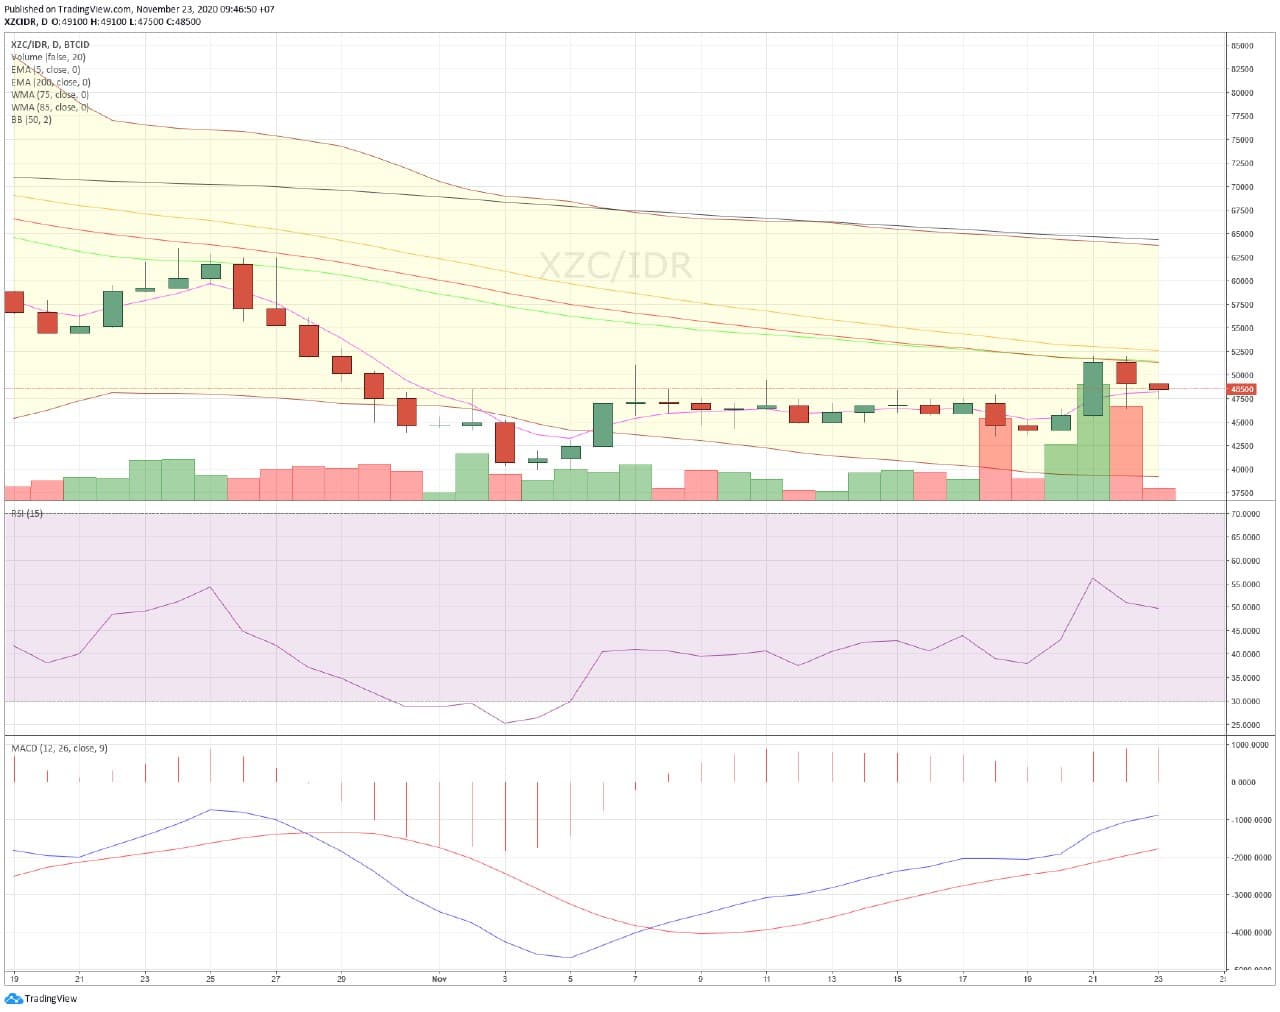
XZC / IDR Chart
In last week’s trading, XZC moved at the lowest level of IDR46,400 and the highest level was IDR50,400.
Here’s XZC technical analysis for this week:
| EMA 5 | 48,172 | sell |
| WMA 75 | 51,350 | sell |
| WMA 85 | 52,567 | sell |
| EMA 200 | 64,389 | sell |
| RSI (15) | 49,5104 | neutral |
| MACD | 12,26 -883.3723 | sell |
| Summary | SELL (5) Neutral (1) |
- Achain Token (ACT)
ACT entered into 5 bearish crypto assets this week. ACT has been decreasing or bearish during this week.
It is estimated that ACT has not made any new innovations in its project so it is predicted that the price will experience a bearish trend for the next week.
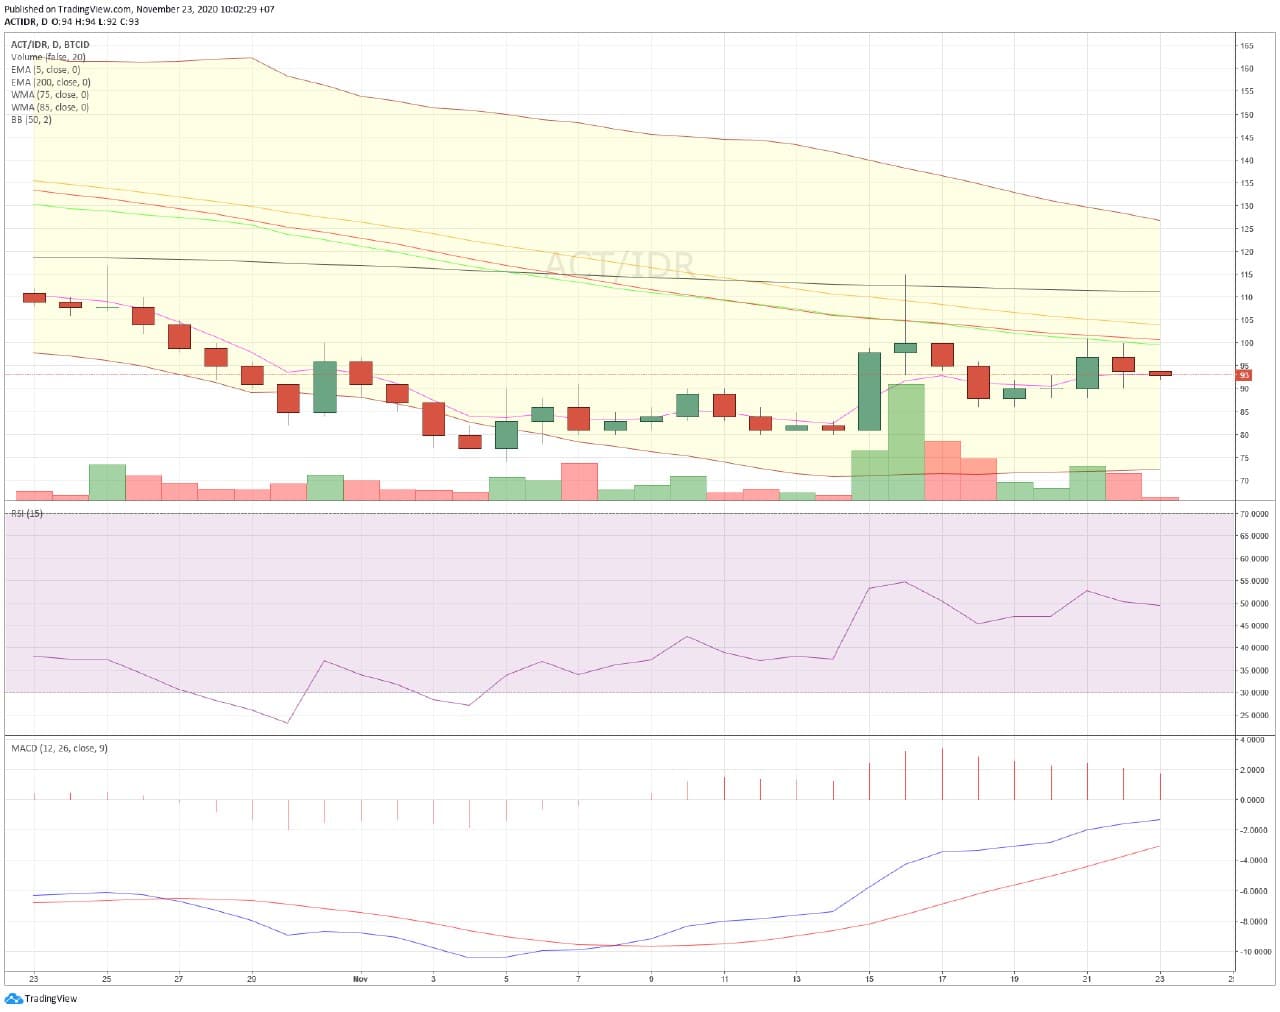
Chart ACT / IDR
In trading last week, ACT is engaged in the lowest level of Rp90 and Rp98 highest level.
Here’s the ACT technical analysis for this week:
| EMA 5 | 93 | sell |
| WMA 75 | 104 | sell |
| WMA 85 | 109 | sell |
| EMA 200 | 112 | sell |
| RSI (15) | 54.6198 | neutral |
| MACD 12.26 | -1.2682 | oversold |
| Summary | SELL (4) Neutral (1) Oversold (1) | |
| Bearish |
- Crypto.com (CRO)
The Crypto.com platform has released its platform in Turkish. Previously, the crypto.com platform had featured various languages, apart from English there were Spanish, Italian, Portuguese and other languages.
However, it seems that the new program will not boost the CRO price in the next week. So that CRO entered into 5 bearish crypto assets this week.
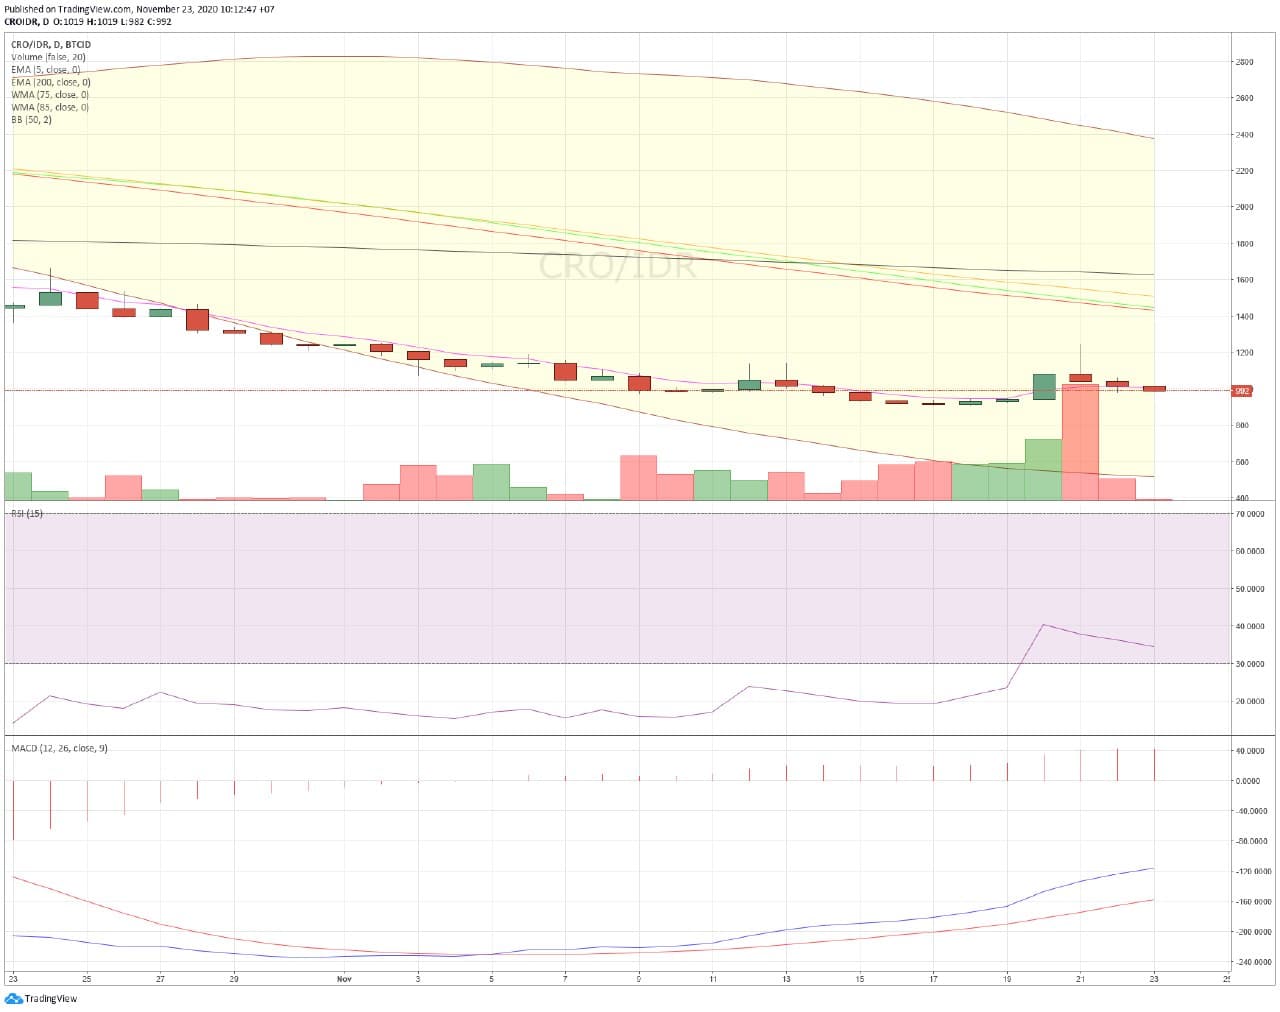
Chart CRO / IDR
In last week’s trading, CRO moved at the lowest level of IDR 980 and the highest level of IDR 1,049.
Here’s the CRO technical analysis for this week:
| EMA 5 | 1,006 | sell |
| WMA 75 | 1,432 | sell |
| WMA 85 | 1,509 | sell |
| EMA 200 | 1,627 | sell |
| RSI (15) | 34.5543 | oversold |
| MACD 12.26 | -116.6662 | oversold |
| Summary | SELL (4) OVERSOLD (2) | |
| Bearish |
- USD Coin (USDC)
USD Coin (USDC) is a stable coin that adheres to the dollar price, such as Tether (USDT). Similar to USDT, the effect of the price of the United States currency on the coin is also a factor in the price decline in the next week.

USDC/ IDR Chart
In trading last week, USDC moved at the lowest level of IDR14,174 and the highest level was IDR14,300.
Here’s the technical analysis for this week’s USD:
| EMA 5 | 14,191 | buy |
| WMA 75 | 14,482 | sell |
| WMA 85 | 14,518 | sell |
| EMA 200 | 14,613 | sell |
| RSI (15) | 41.4564 | sell |
| MACD 12.26 | -96.4279 | oversold |
| Summary | BUY (1) SELL (4) OVERSOLD (1) | |
| Bearish |
NOTE: If EMA 5 crosses the WMA 75, 85 and EMA 200 lines and these lines intersect from bottom to top, then the market trend tends to go up (bullish),
in each table above shows that the value of EMA 5 is higher than WMA 75, 85 and EMA 200 then the market tends to go up (bullish).
If the RSI and MACD values ??show the same condition, it means that the market is showing the same trend, overbought condition or oversold condition is an indicator that the market is at a point of changing the trend direction.
ATTENTION: All content which includes text, analysis, predictions, images in the form of graphics and charts, as well as news contained on this website, is only used as trading information only, and does not constitute a suggestion to take any action in a transaction whether to buy or sell certain crypto assets. All crypto asset trading decisions are independent decisions by the user. Therefore, all risks arising from it, whether it is profit or loss, are not the responsibility of Indodax.
 Market
