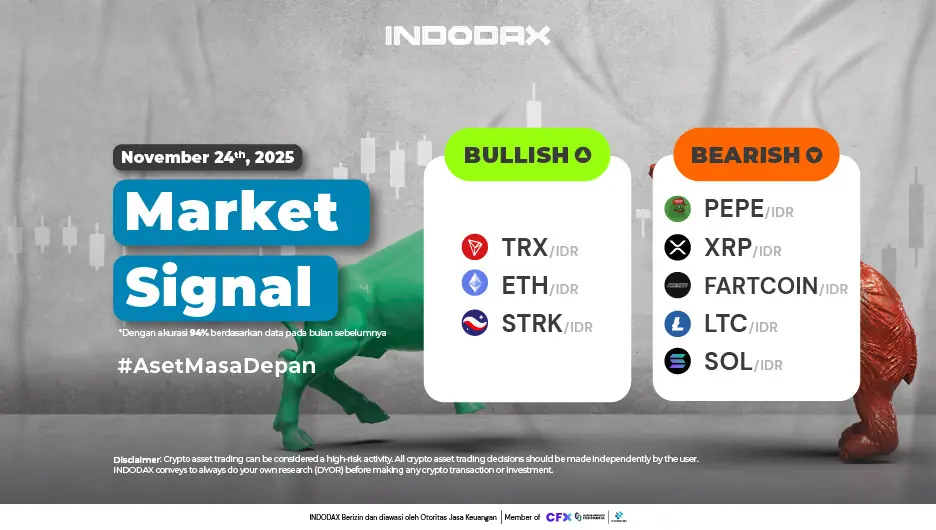
This week, the bullish crypto lineup is led by Tron(TRX) in first place, followed by Ethereum(ETH) and Starknet (STRK)
Want to know how your favorite crypto asset is performing? Check INDODAX Market Signal below!
3 Bullish Crypto Assets
1.Tron (TRX)

Bitcoin (BTC) is weakening, with the current price breaking below the 85-day moving average (WMA/85), a previous trend confirmed as negative by the MACD indicator. The weakening will test the support level of 1,400,000,000 – 1,500,000,000. A breakout of this area will put pressure on the 200-day moving average (EMA/200).
2.Ethereum (ETH)

The movement of Ethereum (ETH) has experienced quite a deep weakening, since failing to penetrate the Resistance area of ??75,000,000 – 80,000,000 Ethereum (ETH) has weakened by more than 30%.
3.Starknet (STRK)

Starknet (STRK) still indicates a bullish trend, with the candle currently moving below the EMA/200. Starknet (STRK) will move higher again, breaking through 3,000 – 3,500, which is a positive support.
5 Aset Kripto Bearish
1.Pepe (PEPE)

The trend gave a negative response after Pepe (PEPE) failed to penetrate the Resistance area of ??0.22 – 0.27. Pepe (PEPE) experienced a correction of more than 50% and confirmed the occurrence of a Bearish phase.
2.XRP (XRP)

XRP (XRP) is indicated to be in a downtrend starting October 11, 2025. XRP responded by weakening by around 20%. The MACD indicator shows strengthening, with XRP testing the 38,000-42,000 range.
3.Fartcoin (FARTCOIN)

The MACD indicator is crossing upwards, indicating that Fartcoin (FARTCOIN) has the potential to strengthen, but Fartcoin (FARTCOIN) is currently being held back by the WMA/85.
4.Litecoin (LTC)

Litecoin (LTC)’s closest resistance is in the price range of 1,700,000 – 1,900,000. If the price can be broken, it will be a positive thing for Litecoin (LTC). Currently, Litecoin (LTC) is moving sideways with a range of 1,340,000 – 1,450,000.
5.Solana (SOL)

The bearish trend is still strong enough to continue, Solana (SOL) has still failed to break through the WMA/85 even though the MACD indicator shows positive movement.
NOTE: If the 5 EMA crosses the WMA 75, 85 and 200 EMA lines and the lines intersect from the bottom up, then the market trend tends to go up (bullish), each table above shows that if the 5 EMA value is higher than the 75.85 WMA and 200 EMA, the market tends to go up (bullish).
If the RSI and MACD values ??show the same condition, it means that the market is showing the same trend. Overbought or oversold conditions are an indicator that the market is already at the point of changing direction of a trend.
ATTENTION: All contents which includes text, analysis, predictions, images in the form of graphics and charts, as well as news published on this website, is only used as trading information, and is not a recommendation or suggestion to take action in transacting either buying or selling. certain crypto assets. All crypto asset trading decisions are independent decisions by the users. Therefore, all risks arising from it, both profit and loss, are not the responsibility of Indodax.
 Market