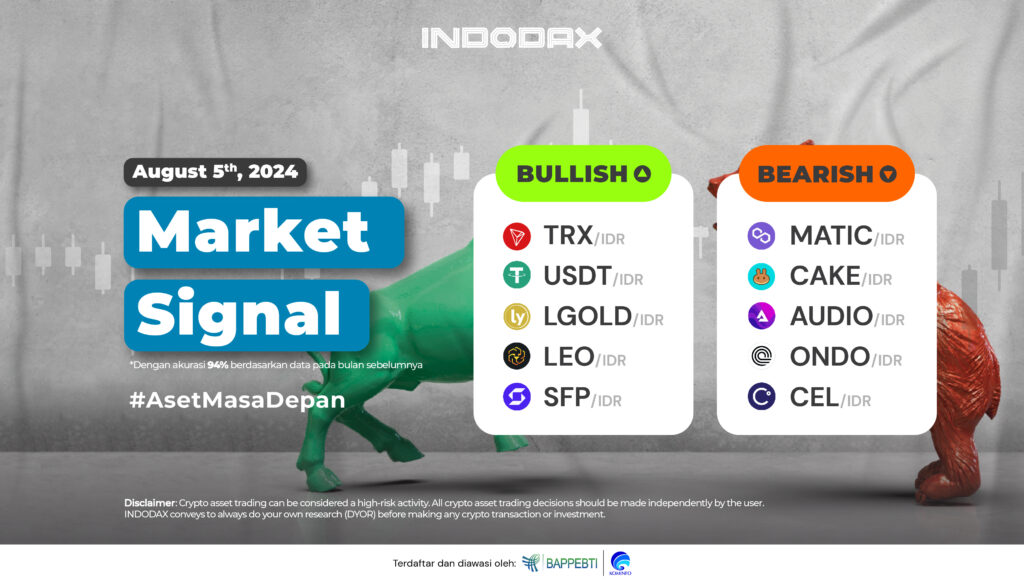
This week, the ranks of bullish crypto assets are led by Tron (TRX) in the first position, and followed by USDT (USDT) and Lyfe Gold (LGOLD).
Want to know the performance of your favorite crypto assets? Check INDODAX Market Signal below!
5 Bullish Crypto Assets
1. Tron (TRX)

Since being in a Bullish trend on March 30, 2023 Tron (TRX) has strengthened by more than 90%. If the trend continues to move positively then indications of Tron (TRX) to pass the Resistance level of 2,150 – 2,350 will be quite wide open.
2. USDT (USDT)

The 4-hour time frame indicates that USDT (USDT) is in the Uptrend zone with the assumption that the current candle movement is being held by the WMA / 85, the trend will continue to strengthen if the candle manages to form above the level of 16,500 – 16,800.
3. Lyfe Gold (LGOLD)

Lyfe Gold can stay above the EMA/200 indicating that the trend can move Bullish which pushes the price to try to break the 980,000 – 1,000,000 fig. One of the indicators such as MACD needs more confirmation, but it will be determined by candles in the 900,000 – 920,000 Support area.
4. Unus Sed Leo (LEO)

On the 1-Day chart movement, Unus Sed Leo (LEO) is still indicated to be stuck at around the price of 86,500 – 100,0000 with the break of the Support level, Unus Sed Leo (LEO) will test the EMA/200, otherwise if it strengthens and breaks the Resistance, the Candle moves above the WMA/75.
5. SafePal (SFP)

The price movement shown illustrates that SafePal (SFP) is experiencing positive changes, but the MACD indicator indicates that the price is moving Sideways in the Bullish zone. If the candle is able to form above the price of 18,000 – 20,000 then indications of a Bullish trend will be stronger.
5 Bearish Crypto Assets
1. Matic Network (MATIC)

Matic Network (MATIC) experienced deep price weakness, after being confirmed to be in the Bearish phase Matic Network (MATIC) corrected more than 40% since May 17, 2024. The current trend is in the Overbought area on the RSI indicator, with further support at the 5,000 level.
2. PancakeSwap (CAKE)

PancakeSwap (CAKE) dominant Support area is estimated to be in the range of 16,000 – 20,000 if this area is broken then PancakeSwap (CAKE) will touch its lowest level, the Resistance area of 33,000 – 40,000 is one of the areas that must be broken if it wants to improve the weakening trend.
3. Audius (AUDIO)

Resistance level at 3,100 – 4,000 which cannot be formed Candle makes Audius (AUDIO) confirmed to be in Bearish phase, this phase will be deeper to continue if Candle formed below 1,600 – 1,900.
4. Ondo (ONDO)

Being in a Bullish phase on July 05, 2024, had a negative impact on the price of Ondo (ONDO) by weakening more than 30%, breaking the Support 17,000 – 18,500 signaling the price weakness that had occurred. The Support area of 10,000 – 13,000 is one of the dominant areas, if broken, it indicates that negative momentum dominates the direction of trend movement.
5. Celsius (CEL)

Price correction of more than 50%, made a sharp price decline in Celsius (CEL). This decline is inseparable from candles that have not been able to stay above the WMA / 85, one indication of strengthening will be created if the trend can move above the level of 7,500 – 8,500 so that the opportunity for EMA / 200 to be successfully broken is great.
NOTES:
If the EMA 5, crosses the WMA 75, 85 and EMA 200 lines, and the lines intersect from bottom to top, then the market trend is upward (bullish).
Each table above shows that if, the value of EMA 5 is higher than WMA 75, 85 and EMA 200, then the market is trending up (bullish).
If the RSI and MACD values show the same condition, it means that the market is showing the same trend, overbought (overbought), or oversold (oversold) conditions are one indicator that the market is at the point of changing the direction of the trend.
 Market