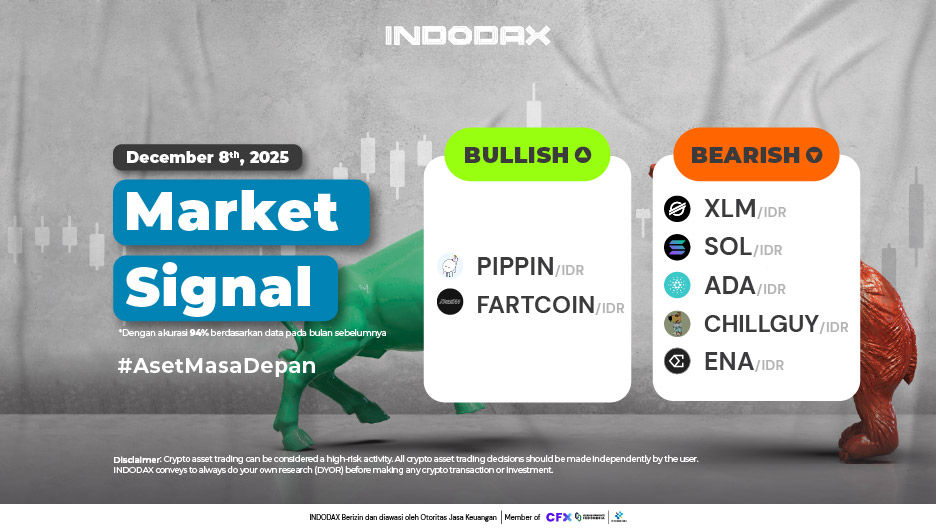
This week, the bullish crypto lineup is led by Pippin (PIPPIN) in first place, followed by Fartcoin(FARTCOIN).
Want to know how your favorite crypto asset is performing? Check INDODAX Market Signal below!
2 Bullish Crypto Assets
1.Pippin (PIPPIN)

Pippin (PIPPIN) has seen significant gains, having surged by more than 150% since entering its bullish phase on November 27, 2025. The bullish trend has also positively impacted Pippin’s price, reaching its highest price at around 5,670.
2.Fartcoin (FARTCOIN)

Fartcoin (FARTCOIN) is projected to strengthen, a bullish trend is indicated on December 5, 2025, if Fartcoin (FARTCOIN) can break through the resistance of 6,900 – 8,000, strengthening will be realized immediately.
5 Bearish Crypto Assets
1.Stellar (XLM)

The 1-Day chart shows that Stellar (XLM) is currently holding above the 2,500-3,500 support level. However, if this support level is broken, the bearish trend will continue even stronger.
2.Solana (SOL)

On the 1 Day time frame, it is indicated that Bearish is still occurring on Solana (SOL), Bearish will experience pressure with Solana (SOL) remaining above the Support area of ??1,650,000 – 2,000,000.
3.Cardano (ADA)

Currently, Cardano (ADA) is being held back by the WMA/85 and needs more time to confirm the direction of price movement. If Cardano (ADA) can break through the price level of 7,700 – 8,000, the trend will confirm a positive direction.
4.Just a chill guy (CHILLGUY)

Just a chill guy (CHILL GUY) is still experiencing negative pressure, unable to move from the WMA/75 so that Bearish still dominates price changes.
5.Ethena (ENA)

Support is available in the range of 2,600 – 4,000. As this area increases, the decline will deepen and the Ethena (ENA) trend will continue to move negatively.
NOTE: If the 5 EMA crosses the WMA 75, 85 and 200 EMA lines and the lines intersect from the bottom up, then the market trend tends to go up (bullish), each table above shows that if the 5 EMA value is higher than the 75.85 WMA and 200 EMA, the market tends to go up (bullish).
If the RSI and MACD values ??show the same condition, it means that the market is showing the same trend. Overbought or oversold conditions are an indicator that the market is already at the point of changing direction of a trend.
ATTENTION: All contents which includes text, analysis, predictions, images in the form of graphics and charts, as well as news published on this website, is only used as trading information, and is not a recommendation or suggestion to take action in transacting either buying or selling. certain crypto assets. All crypto asset trading decisions are independent decisions by the users. Therefore, all risks arising from it, both profit and loss, are not the responsibility of Indodax.
 Market