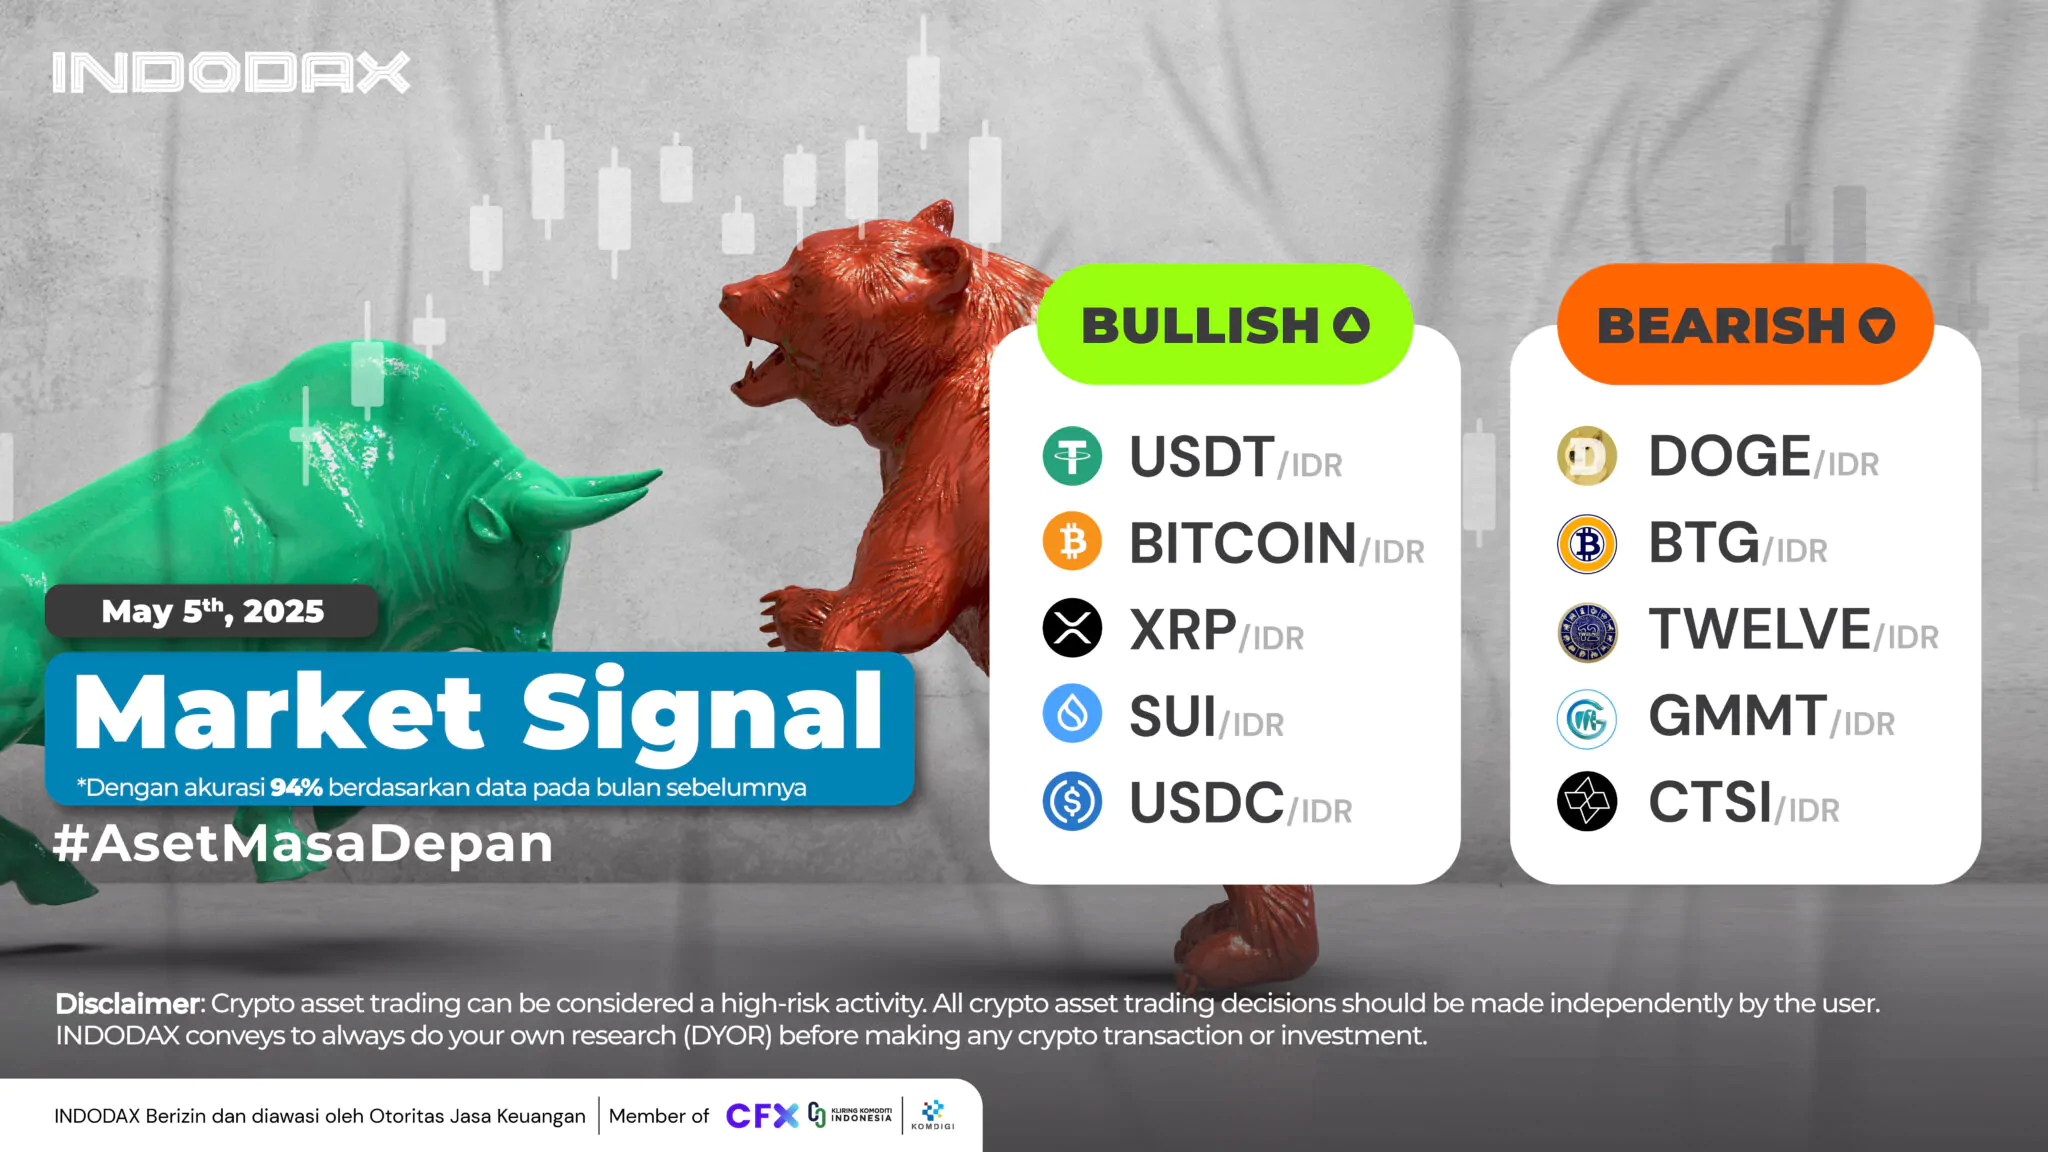
This week, the bullish crypto lineup is led by USDT(USDT) in first place, followed by BITCOIN(BTC) and XRP(XRP).
Want to know how your favorite crypto asset is performing? Check INDODAX Market Signal below!
5 Bullish Crypto Assets
1.USDT (USDT)

Failure to form a Candle above the Resistance level of 17,100 – 17,300 caused USDT (USDT) to experience a correction and move below WMA / 85. The weakening is depicted by the MACD indicator will be deeper, with the direction of testing the Support zone in the range of 16,000 -16,400 levels.
2.Bitcoin (BTC)

The movement of the Bitcoin (BTC) trend over the past few times has had a fairly good price movement, able to stay above WMA/85 with Bitcoin (BTC) moving away from Support 1,300,000,000 – 1,450,000,000 plus the MACD indicator indicating a positive direction makes the assumption that Bitcoin (BTC) will move up quite significantly.
3.XRP (XRP)

The two lines on the MACD indicator are narrowing in line with the price movement of XRP (XRP) which has not experienced any significant price changes, breaking through Support 25,000 – 30,000 will increase the chances of XRP (XRP) moving below the WMA/85 line.
4.Sui (SUI)

Failure to penetrate Resistance 60,000 – 65,000 has a negative impact on the price change of Sui (SUI), the MACD indicator confirms the negative trend movement of Sui (SUI). The Sui (SUI) trend will remain in the Bullish phase with the Candle remaining above the price of 38,000 – 40,000.
5.USDC (USDC)

The 1 Day time frame used still indicates that USDC (USDC) is holding strong enough in the Uptrend zone, but the Bullish trend will fail to continue with the penetration of Support 15,600 – 16,050. The candle will move weaker beyond EMA/200.
5 Bearish Crypto Assets
1.Dogecoin (DOGE)

The current Dogecoin (DOGE) trend is being held back by WMA/8.5??Dogecoin (DOGE) currently needs more time to confirm the direction of the next price movement, the strengthening will try to test EMA/200.
2.Bitcoin Gold (BTG)

The Bearish Trend is one of the causes of the weakening price of Bitcoin Gold (BTG), in the Bitcoin Gold (BTG) time frame it has weakened by more than 60%. The negative direction still haunts Bitcoin Gold (BTG) with the current trend being suppressed by WMA/85.
3.TWELVE ZODIAC (TWELVE)

TWELVE ZODIAC (TWELVE) is still continuing the Bearish trend, the failure of the candle to form above the EMA/200 can be an indication, but this is also supported by the Resistance of 5,000 – 8,000 which cannot be passed.
4.Giant Mammoth (GMMT)

The trend had experienced quite a dynamic movement with the trend tending to move positively, but the lack of momentum to continue strengthening could not encourage Giant Mammoth (GMMT) to penetrate Resistance 240 – 350.
5.Cartesi (CTSI)

The Bearish trend will increasingly dominate the next trend change, with Support 620 – 1,000 unable to withstand the weakening trend, the MACD indicator allows the line to intersect in a negative direction.
NOTE: If the 5 EMA crosses the WMA 75, 85 and 200 EMA lines and the lines intersect from the bottom up, then the market trend tends to go up (bullish), each table above shows that if the 5 EMA value is higher than the 75.85 WMA and 200 EMA, the market tends to go up (bullish).
If the RSI and MACD values ??show the same condition, it means that the market is showing the same trend. Overbought or oversold conditions are an indicator that the market is already at the point of changing direction of a trend.
ATTENTION: All contents which includes text, analysis, predictions, images in the form of graphics and charts, as well as news published on this website, is only used as trading information, and is not a recommendation or suggestion to take action in transacting either buying or selling. certain crypto assets. All crypto asset trading decisions are independent decisions by the users. Therefore, all risks arising from it, both profit and loss, are not the responsibility of Indodax.
 Market