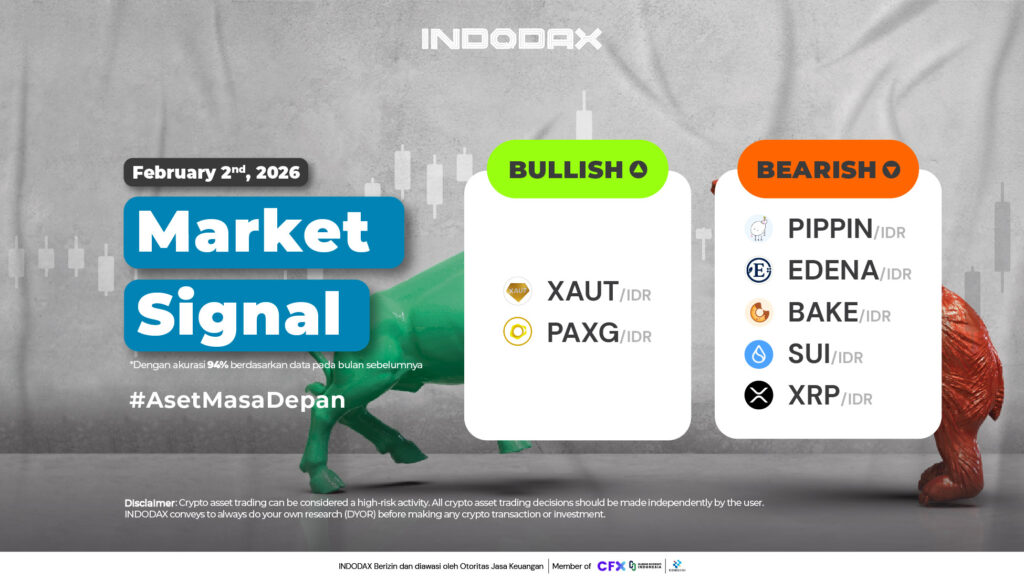
This week, the bullish crypto lineup is led by Tether Gold (XAUT) in first place, followed by Pax Gold (PAXG) .
Want to know how your favorite crypto asset is performing? Check INDODAX Market Signal below!
2 Bullish Crypto Assets
1.Tether Gold (XAUT)
Having been in the overbought area, it indicated that Tether Gold (XAUT) had quite strong positive momentum. However, Tether Gold (XAUT) is currently experiencing a correction, with the trend moving away from the overbought area. The 72,000,000-76,000,000 area is quite important for the bullish phase.
2.Pax Gold (PAXG)
The trend is still moving above WMA/85 even though the MACD indicator shows a weakening trend with a line that cuts downwards. If the Support 65,000,000 – 75,000,000 is broken, it opens up the opportunity for Pax Gold (PAXG) to move below WMA/75.
5 Bearish Crypto Assets
1.Pippin (PIPPIN)
Pippin (PIPPIN) has just been indicated to be in a bearish trend, this trend will be maintained with candles moving below the 2,200 – 3,000 area.
2.Edena (EDENA)
Failure to form a candle above the 20,000 – 28,000 area means Edena (EDENA) failed to move above the EMA/200.
3.Bakery Token (BAKE)
The absence of significant movement in sales or purchases has caused the Bakery Token (BAKE) trend to stagnate, the RSI indicator currently indicates that Bakery Token (BAKE) is in the oversold area.
4.Sui (SUI)
On the 1 Day time frame, Sui (SUI) was confirmed to be in a Bearish phase since October 31, 2025, which had a negative impact on the decline in the price of Sui (SUI) which has weakened by more than 50%.
5.XRP (XRP)
Failure to break the 200-EMA (EMA) changed XRP’s momentum, with the MACD indicator turning negative, with the line crossing downwards. Support in the 15,000-25,000 range is crucial for XRP.
NOTE: If the 5 EMA crosses the WMA 75, 85 and 200 EMA lines and the lines intersect from the bottom up, then the market trend tends to go up (bullish), each table above shows that if the 5 EMA value is higher than the 75.85 WMA and 200 EMA, the market tends to go up (bullish).
If the RSI and MACD values ??show the same condition, it means that the market is showing the same trend. Overbought or oversold conditions are an indicator that the market is already at the point of changing direction of a trend.
ATTENTION: All contents which includes text, analysis, predictions, images in the form of graphics and charts, as well as news published on this website, is only used as trading information, and is not a recommendation or suggestion to take action in transacting either buying or selling. certain crypto assets. All crypto asset trading decisions are independent decisions by the users. Therefore, all risks arising from it, both profit and loss, are not the responsibility of Indodax.
 Market