In crypto trading, technical analysis is a method used by traders to predict asset price movements based on historical price and trading volume data. The importance of technical analysis in crypto trading cannot be ignored, mainly because the crypto market is known for its high volatility. Traders use various technical tools and indicators to make smarter trading decisions and reduce the risk of loss.
One of the important tools in technical analysis is the Average Directional Index (ADX). ADX is an indicator that helps traders to identify the strength of the ongoing trend in the market. Developed by Welles Wilder, ADX measures trend strength with a value between 0 and 100. A high ADX value indicates strong trend strength, while a low value indicates weak or sideway market conditions.
So, to learn more about what ADX is, how to read the indicators, examples of easy ways to read the indicators when trading, and the secret to how to use the ADX indicator for trading, see the complete review below!
What is ADX?

Average Directional Index (ADX) is a trading indicator used to identify strengthening price trends and measure the strength of these trends. This indicator calculates the moving average of the expanding price range over a certain period, usually 14 days.
ADX has a value that fluctuates from 0 to 100, with limits generally between 20 and 50. The ADX value below 20 indicates a relatively weak trend, while values ??above 50 indicate a very strong trend. The ADX indicator not only identifies the direction of the trend but also provides important information about how strong the trend is. Therefore, ADX is often used as an accurate companion indicator along with other indicators in determining the direction and strength of trend movements.
One of the advantages of ADX is the universality of its use. This indicator can be applied to various types of investment assets, including stocks, forex, and cryptocurrencies. Thus, traders can use ADX as a valuable tool in technical analysis to make more informed trading decisions and better manage risk.
How to Read ADX Indicator?
Knowing how to read the Average Directional Index (ADX) indicator is very important in trading because it can provide deep insight into the strength and direction of market trends.
By understanding how to read the ADX indicator, traders can make smarter trading decisions and approach the market with the knowledge necessary for success. When reading the ADX indicator, two important aspects must be considered, namely:
1. Pay attention to the Average Directional Index Value
Note the relationship between ADX value and trend strength in the following table:
ADX values |
Trend Conditions |
|
Increasingly Rising |
Strengthening Trend |
|
Descending |
Weakening Trend |
|
Under 20 |
Weak Trend |
|
Between 20—40 |
Strong Trend |
| Above 40 |
Very strong/extreme |
Apart from the ADX value itself, the direction of the ADX line is also important for reading the trend’s strength. The higher the ADX value, the stronger it is, and the price tends to move toward the trend. Conversely, if the ADX value decreases, the trend’s strength weakens, and the price may experience a correction or consolidation.
However, one common mistake is considering a decline in the ADX line as a change in trend direction. A decrease in the ADX value only shows weakening strength, not a change in trend direction. It is important not to misinterpret this to avoid market entry errors that can occur due to assuming the trend is changing when, in fact, the price is only experiencing correction or consolidation.
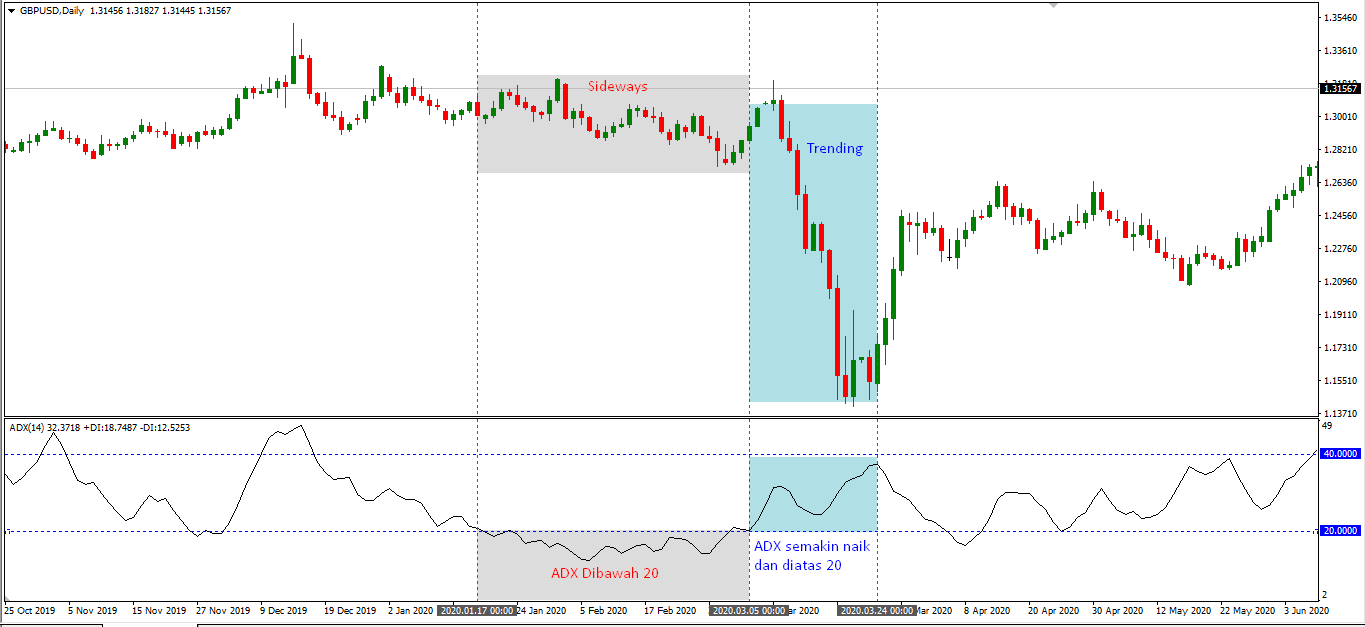
Let’s look at an example of identifying trend strength on the price chart below:
(Image Source: inbizia.com)
In the chart above, when the ADX value is below 20, the price is sideways. However, when the ADX value rises and goes beyond 20, it indicates that the trend is beginning to strengthen. The standard period for this indicator is 14.
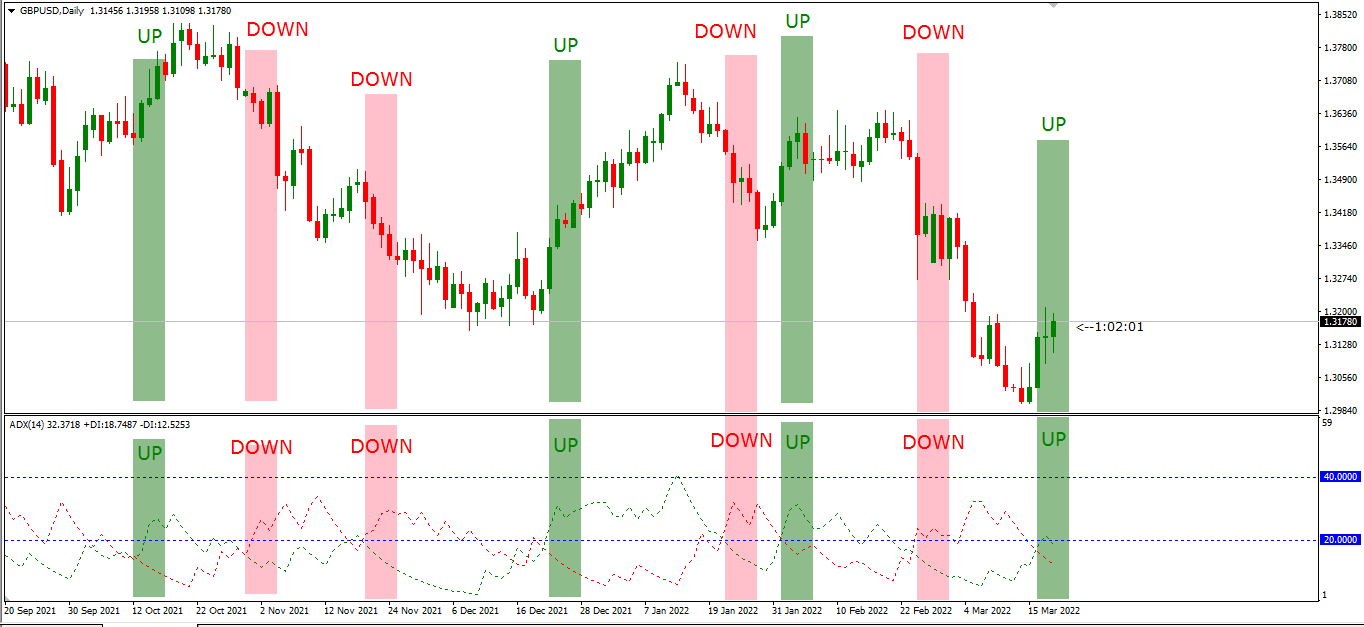
2. Pay attention to the intersection of the +DI and -DI lines
When the +DI line crosses from below to above the -DI line, it signals a change in direction to an uptrend in the market. Conversely, if the -DI line crosses from below to above the +DI line, it indicates a shift in direction to a downtrend.
However, it is important to remember that relying solely on the crossover of the +DI and -DI lines can get us trapped in a flat or sideways market situation. Therefore, using ADX values as the main guideline for identifying market trends is very important. It is important to remember that the ADX indicator provides the most effective results when the market is trending. If the market is flat or sideways, you should avoid opening a position because this could cause unnecessary risks.
To understand the concept of +DI and -DI crossovers, take a look at the example graph below:
(Image Source:: inbizia.com)
However, it is best to remember that the intersection of the +DI and -DI lines is only one element in your analysis. Use this information and the ADX value to make more informed trading decisions and reduce risks in flat or ranging market conditions.
Example of an Easy Way to Read the ADX Indicator when Trading
Understanding how to easily read the Average Directional Index (ADX) indicator when trading is very important, especially because it can provide valuable clues about the strength and direction of market trends. By understanding examples of how to read the ADX indicator easily, traders can make more informed trading decisions and optimize their profit opportunities in various market conditions.
To find out an example of an easy way to read the ADX indicator when trading, see the image below:

(Image Source: The Options Guide)
Sideways Trend
At the top of the graph, you can see stagnant or sideways price movements. This is confirmed by the ADX chart at the bottom (circled in yellow), where the ADX value is less than 20, indicating no price movement trend occurring.
Trend Formation
However, when you look at the right side of the graph at the top, you can see a significant price drop. This bullish trend is also supported by the fact that the +DMI line is above the -DMI, and the ADX value has increased beyond 30. This condition indicates a strong trend, indicating the possibility of a significant bullish trend shortly. By combining information from both charts, traders can identify changes in market conditions from sideways to bullish trend.
However, it is important to keep an eye on the ADX value and consider other factors before making a trading decision to ensure that other indicators also support the identified trend signal.
Secrets on How to Use the ADX Indicator for Trading

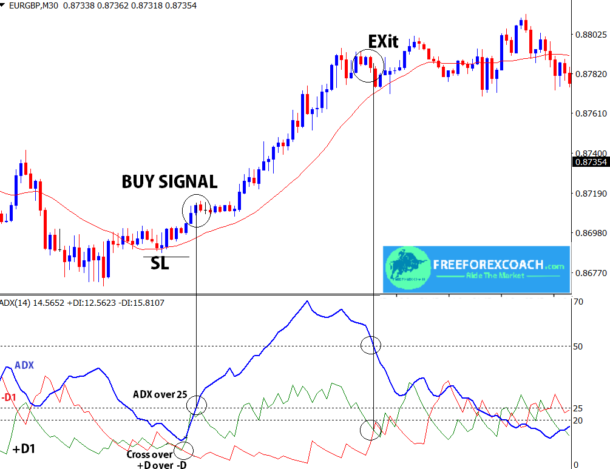
Knowing the secret of using the ADX indicator in trading is an important step for traders. By understanding them, traders can make more informed trading decisions, increase their chances of success, and reduce the risk of loss in a complex and fluctuating trading environment. First, look at the image below:
(Image Source: Free Forex Coach)
There are several important secrets when using the ADX indicator for trading by paying attention to the methods below, including:
1. Buy Signal
When the +DMI line crosses from below to above the -DMI line, and the ADX value has exceeded 25, it is a good time to consider purchasing the asset, indicating the strength of the bullish trend is quite strong.
2. Stop Loss
It is important to anticipate the possibility of trend movements that do not match expectations by setting a stop loss. Typically, the stop loss can be placed several points below the price of the candle in the previous sideways phase, leaving room for normal price movement.
3. Take Profit
Meanwhile, to set the profit-taking point using the ADX indicator, wait until the -DMI line crosses from below to above the +DMI line. This can be considered the optimal point to take advantage of your trading position.
Conclusion
In conclusion, the Average Directional Index (ADX) indicator is important in crypto market trend analysis. In a volatile market like crypto, ADX provides insight into the strength and direction of price trends.
By understanding ADX, traders can identify strong trends, obtain confirmed trading signals, manage effectively, and anticipate trend reversals. It should be emphasized that it is important to understand and master the use of ADX in trading on the crypto market. By learning more about these technical analysis tools, traders can improve their skills and make better trading decisions thereby achieving success in the crypto markets.
Crypto Trading on INDODAX
So, now you understand what ADX is, how to read the indicators, examples of easy ways to read the indicators when trading, and the secret of how to use the ADX indicator for trading. Furthermore, you can also read other interesting articles, such as types of MACD indicators on INDODAX Academy.
As a reminder, INDODAX Academy is the best platform for learning more deeply about blockchain and crypto assets in general. With access to a variety of quality educational resources, INDODAX Academy provides learners with the opportunity to understand basic concepts about blockchain technology, and crypto trading, as well as in-depth market analysis.
Next, after you understand the ADX indicator and how to use it, as explained earlier, now is the time for you to trade crypto on INDODAX. For your information, INDODAX is the best crypto exchange guaranteed to be safe and reliable. With a focus on security and reliability, INDODAX gives its users access to various advanced trading features and a wide variety of crypto pairs.
So what are you waiting for? Come on, start trading crypto on INDODAX now!
 Market

