Technical analysis is a method of studying price movements using historical data, such as price and volume charts. This method helps traders understand market trends and predict potential price reversals.
One important pattern in technical analysis is the Double Top, which occurs when the price fails to break through the highest level twice. This pattern is often an indicator of a trend reversal from bullish to bearish, helping traders determine strategic steps in trading.
Now, to better understand what the Double Top pattern is, how to identify it, when this pattern occurs in trading, and how to use it in trading, see the full review below.
What Is a Double Top Pattern?

The Double Top pattern is one of the chart formations that is widely used by traders. This pattern is useful for determining the moment of take profit or as an opportunity to open a short position.
In essence, this pattern indicates a trend reversal from bullish to bearish.
A chart pattern that indicates a potential trend reversal from an uptrend (bullish) to a downtrend (bearish).
The double top pattern is a formation that indicates a possible trend reversal from an uptrend (bullish) to a downtrend (bearish).
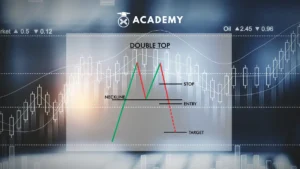
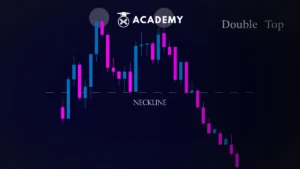
This pattern gets its name because it forms when the price reaches two highest peaks separated by a temporary decline in between. Visually, this pattern resembles two mountains with a valley in the middle.
Pattern Structure
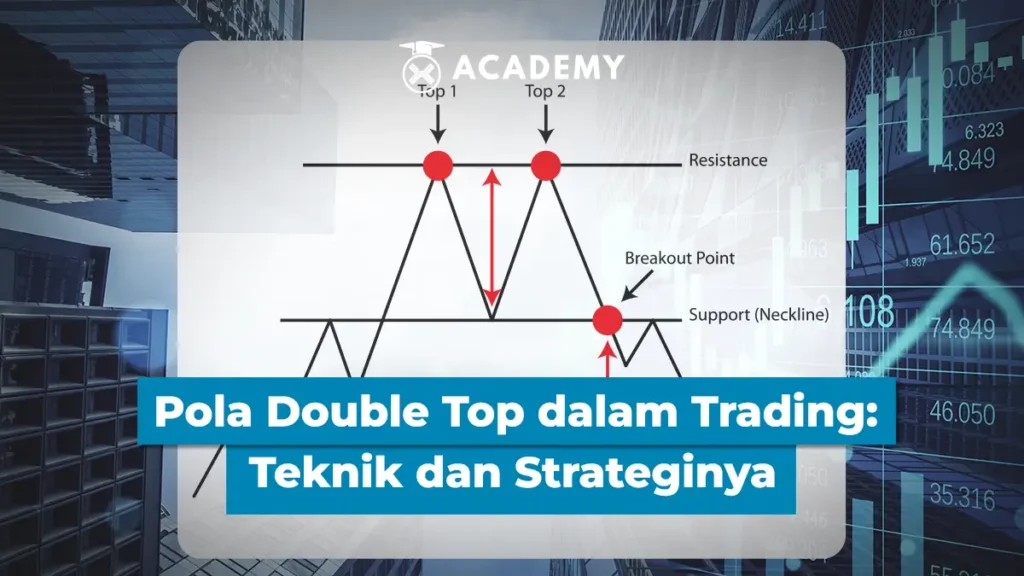
At the first peak, this pattern begins when the price reaches a new high in an uptrend, reflecting the dominance of buying pressure in the market.
After reaching the first peak, the price experiences a temporary decline and forms a support level, which is an early sign of a potential change in momentum.
At the second peak, the price rises again to approach or match the level of the first peak, but fails to break through it. This reflects increasing selling pressure and weakening buying power.
After the formation of the second peak, the price experiences a sharper decline until it breaks through the support level, confirming the Double Top pattern as a trend reversal signal.
Trend Reversal Signal
The Double Top pattern is an indication that the uptrend has lost its momentum, indicating that the market is ready to reverse direction towards a downtrend.
This pattern is often used as a reference for traders to anticipate price reversals, both to determine when to exit a buy position or open a sell position.
How to Identify a Double Top Pattern?

The Double Top pattern forms when price reaches two nearly equal peaks separated by a support level. Here’s how to identify the pattern.
Visual Characteristics of the Pattern
The Double Top pattern can be recognized by two nearly equal price peaks, separated by a support level. After the two peaks form, the price tends to fall and there is a potential for a breakout to the downside, indicating that the market is starting to lose momentum.
The Right Time to Identify
This pattern usually forms after a significant uptrend, when the market has reached saturation and there is an indication that buying pressure is starting to diminish.
Trend Reversal Confirmation
The main confirmation of the Double Top pattern is when the price breaks through the support level located between the two peaks. This breakout indicates that the uptrend is over, and the market is likely to reverse into a downtrend (bearish).
When Does the Double Top Pattern Occur in Trading?
The Double Top pattern appears after a strong uptrend, indicating a sign that the market is starting to lose momentum.
This pattern indicates a possible reversal to the downtrend, which gives traders the opportunity to plan a more appropriate strategy.
Types of Markets Suitable for This Pattern
The Double Top pattern most often occurs in markets that show a strong uptrend before finally reversing.
When the market has experienced significant upward movement and reaches a point of saturation, this pattern can form as a sign that the bullish momentum is starting to weaken.
Double Top Pattern in Various Financial Instruments
This pattern can be found in various financial instruments, including stocks, currencies (forex), commodities, and crypto.
Since this pattern indicates a trend reversal, the Double Top pattern is very relevant for various types of markets, both liquid and more volatile.
Example Use Cases of the Pattern
For example, the Double Top pattern can be applied to popular currency pairs such as EUR/USD or to major stocks such as Apple or Tesla.
When the price reaches two nearly equal peaks and fails to break through the high, traders can use this pattern to anticipate a price reversal and plan a sell position.
How to Use the Double Top Pattern for Trading Strategy
The Double Top pattern can be used to design an effective trading strategy by identifying the right entry, exit, and risk management points. Here’s how to use it in trading.
Entry Point
The right entry point is when the price breaks through the support level formed between the two peaks. A sell signal is given when the price successfully breaks through the support level with strong volume, indicating a potential trend reversal.
Exit Point
The price target can be calculated based on the distance between the peak and the broken support level. By calculating the height of the pattern, traders can determine how far the price is likely to move down.
The use of stop losses is also important to protect against losses if the market moves in the opposite direction.
Risk Management
Using stop losses and take profits is essential to limit losses and secure profits.
In addition, combining additional analysis, such as other technical indicators (eg Relative Strength Index/RSI or Moving Average Convergence Divergence/MACD), can help strengthen trading decisions and improve the accuracy of the analysis.
Advantages and Risks of Using the Double Top Pattern
As with any trading strategy, using the Double Top pattern has advantages and risks that need to be considered. Here is a full explanation.
Advantages
The Double Top pattern provides a clear signal regarding a possible trend reversal from up to down, providing trading opportunities with more controlled risk.
Because it forms after a significant uptrend, this pattern provides a strong indication of a change in price direction. In addition, the Double Top pattern is relatively easy to recognize on the price chart so traders can quickly identify trading opportunities.
Risks
Although it provides a clear signal, the Double Top pattern is not always accurate and can sometimes fail, producing false signals that can be detrimental to traders.
Therefore, it is very important to wait for strong confirmation through a breakout of the support level to ensure the validity of this pattern. Without clear confirmation, traders can risk entering the market too early and facing losses.
Let’s Invest in Crypto at INDODAX
Next, if you are interested in making crypto investments easily, safely, and profitably, such as buying bitcoin, buying Ethereum, or buying other crypto assets, then you can buy them at INDODAX Market.
In addition, to make it easier to trade crypto safely and easily, you can download the best crypto application from INDODAX on the Google Play Store or via the App Store right now!
For your information, INDODAX is currently the largest and most trusted crypto asset trading platform in Indonesia.
With more than 6,000,000 members, INDODAX has become a pioneer in buying and selling crypto assets in the country, offering various types of crypto assets, such as Bitcoin, Ethereum, Dogecoin, and others.
INDODAX also continues to be committed to providing easy access for investors to join the crypto asset market.
However, it is important to understand that investing in crypto assets has risks, like any other investment. These risks include fluctuations in value and high volatility that can occur in crypto assets.
Therefore, it is advisable to do in-depth research first before deciding to invest or trade in crypto assets.
So, let’s start investing in crypto assets with a trusted and best platform, only at INDODAX!
Conclusion
Well, that was an interesting discussion about Understanding the Double Top Pattern and How to Use It that you can read in full at the Crypto Academy at INDODAX Academy.
In conclusion, the Double Top pattern is one of the important patterns in technical analysis that is effective in identifying trend reversals from bullish to bearish.
This pattern provides clear instructions for traders to anticipate price movements that are likely to change direction, especially after a strong uptrend.
By observing this pattern, traders can be better prepared to respond to market shifts and make the right decisions.
For traders, the Double Top pattern is very useful to help determine entry points in opening sell positions and managing risk more efficiently.
This pattern can be a reference in planning a more structured and profitable trading strategy. However, it is important for traders not to rely on just one pattern.
The use of additional technical analysis tools, such as other indicators, as well as the application of good risk management, will further strengthen trading decisions and reduce potential losses.
FAQ
1.What is the Double Top pattern?
The Double Top pattern is a technical chart formation that indicates a potential trend reversal from an uptrend (bullish) to a downtrend (bearish). The pattern forms when the price reaches two nearly identical highs with a price decline in between.
2. How to identify a Double Top pattern?
A Double Top pattern has two nearly identical price peaks followed by a decline that forms a support level. Confirmation of a trend reversal usually occurs when the price breaks through this support level with strong volume.
3.When is the best time to use the Double Top pattern in trading?
The Double Top pattern is most effective after a strong uptrend, as it indicates that the trend may reverse. A breakout of the support level between the two peaks can be a signal to open a sell position.
4.What are the advantages and risks of using the Double Top pattern?
The advantage of the Double Top pattern is that it provides a clear trend reversal signal, which helps in making sell decisions. However, the main risk is false signals, which can occur if the price fails to break through the support level.
5.How to manage risk when trading with the Double Top pattern?
Using stop losses and take profits is the main way to manage risk. Traders can also use additional technical indicators such as RSI or MACD to ensure the validity of the signal from the Double Top pattern.


 Polkadot 9.23%
 BNB 0.47%
 Solana 4.89%
 Ethereum 2.37%
 Cardano 1.22%
 Polygon Ecosystem Token 2.16%
 Tron 2.83%
 Market


