There is a way where there is a will, and this proverb is suitable for those who keep trying.
For example, for those who want to gain and increase their income, one way is through the trading world.
Of course, Indodax friends who are used to trading are very familiar with various patterns and shapes of candlestick signals and asset price charts that display the rise and fall of crypto asset values over a certain period.
Talking about trading in more depth, we will find various kinds of moves in it, such as using an algorithm, up to the manual method, like in the morning at 06.00 before changing the candlestick.
There are various candlesticks, for example, Hammer, Morning Star, Shooting Star, and Doji. This time we will dig deeper into what is a Doji Candle. Let’s discuss it!
What are Doji Candles?

What is a Doji Candle? The word doji means blunder or mistake, which comes from the Japanese. Doji Candle is a pattern or shape to determine the ups and downs of a coin or stock price at a specific time.
It is also used to find indications of asset prices when the opening and closing limits are almost the same.
What about the shape? A doji candle visually looks like a “plus” sign (+) in a calculator and is generally green and red.
For those of you who like and are interested in the world of trading, you must also master the doji candle & its derivatives as one of the absolute requirements to gain money.
Types of Doji Candle

It doesn’t stop there, and the Doji candle also has several derivatives, such as standard doji, gravestone doji, and hammer doji. You also need to know this to read movements from asset price reversals.
Always DYOR (Do Your Research) to determine your investment needs. Let’s peel it further!
1. Standard Doji
We first discuss the Standard Doji, a candlestick that could be more meaningful for predicting the next market movement.
To understand the meaning of this candlestick, traders observe previous price movements until a Doji pattern occurs.
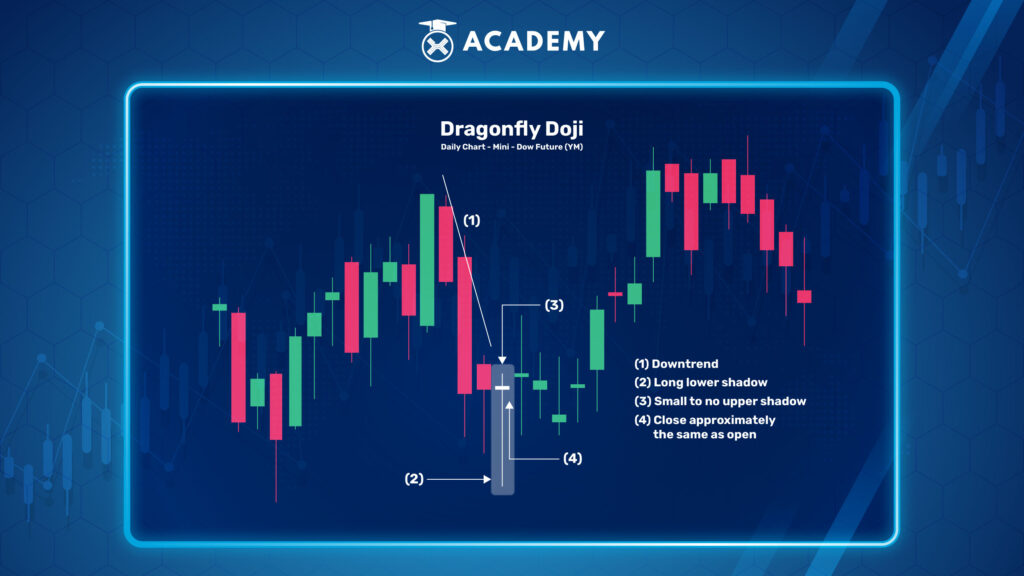
2. Dragonfly Doji
In the second place, the Dragonfly Doji candlestick will appear at the top of an uptrend or below a downtrend, indicating a possible change in direction.
No line above the horizontal bar forms a T, which is a sign that the price has not moved above the opening price. At the same time, the lower wick that extends strongly from this Doji is a bearish signal.
3. Long-legged Doji
In the third line, Long-legged Doji has a longer chart (axis) down than up.
This suggests that the candlestick moved up and down reactively to changes in price but closed at the same level as it opened.
The axis is the same in one period of forming a bar. Usually, this event shows sentiment or indecision between buyers and sellers over the dynamics of price fluctuations in the market.
4. Gravestone Doji
Furthermore, the Gravestone Doji is the opposite of the Long-legged Doji. This doji appears when price action opens and closes at the bottom of a trading range.
When the candle is opened, buyers can trigger the price to be higher, thus also causing selling momentum to start increasing, but when the candle is closed, they cannot maintain the bullish momentum. At the top of an uptrend, this is a bearish signal.
5. Price Doji
Price Doji is just a horizontal line without a vertical line above or below the horizontal line, so there is no axis pattern.
This doji pattern marks the final uncertainty because a candle’s high, low, open, and close (four prices) are the same.
Price Doji is a unique pattern indicating uncertainty (indecision) or a calm market.
6. Evening Doji Star
A rising candle precedes the Evening Star during an uptrend. The focus point of this candle is the doji candle or minor body candle that moves away from the previous candle.
The entire formation after the close of the third candle is lower than the close of the doji candle, with a body of at least half the volume of the first candle.
When this happens, traders must be prepared that the price may fall, especially if they start to see the Evening Star pattern continue to increase.
7. Hammer Doji
The Hammer Candlestick is one of the candles that traders can find when looking at prices in the crypto and other asset markets.
Hammer Candlestick refers to a candlestick on an asset chart that is visually shaped like a hammer and has a shadow (wick) twice the size of the actual body.
The candle’s body represents the difference between the open and close prices, while the lower shadow shows the high and low for that trading period.
How to Use Doji Candles When Trading
It’s like diving in the ocean; we must understand various ways of swimming, breathing techniques, and getting to know the ocean currents.
Now it’s the same as diving in the ocean. This also applies when we invest or trade in high-risk financial instruments such as crypto.
A doji candle indicates that the current price action is “neutral,” i.e., there is no trend up or down.
Several types of doji provide specific signals, but other technical indicators must accompany their use in stock trading to confirm these signals.
Many people are mistaken, believing that the Doji is a sign of a bearish buy/sell trend.
Then they make the wrong decision because the market is just a “wait-and-see” while the doji is forming.
The long tail of the Dragonfly Doji and Gravestone Doji can be an early warning of a trend reversal. However, traders should wait for a new candle to form to establish a buy point and stop losses.
We also need other indicators to determine the target profit technique.
How to Read a Doji Candle Accurately

When reading a Doji Candle pattern, we need to be aware of previous price changes, which can be reflected at the end of the trade. The question is, how to read candlestick patterns? Here’s the review:
1. Pay attention to the shape of the body size of the candlestick
For example, the candle’s body is significant, while the tail is small. This indicates a strong price movement.
If the body is longer and the tail is smaller, then the power of the candle is good or positive.
It is very useful & important to consider formations for those of you who are involved in trading. The pattern’s height eventually becomes one of the strongest parts of the buyer or seller.
The size of the body is a good business opportunity. Conversely, a declining situation is a sign of a weak side.
2. Always monitor the wick or tail of the candlestick
When you see a long tail and a large body at the end, it means a bearish trading moment, and a reversal is possible.
The length of the wick also determines the volatility of the price movement. The long wick shows the rapid price movement after being rejected by resistance. While the axis lengthens, volatility also increases.
3. Read & understand body and axis ratios
If the position of the pattern is in the middle with two tail axes, this indicates that the forces between buyers and sellers are balanced.
In general, such a position also indicates market indecision. Market retention will last longer as the wick gets longer and the body gets smaller.
Conclusion
We already know various kinds of ammunition in trading, from knowing the meaning of doji candles and understanding how to use them to read candlesticks.
Remember always to prioritize Do Your Own Research (DYOR) in knowing your needs & limitations in trading, which helps avoid losses.
Through DYOR, it will prevent us from potential coin pumps from irresponsible parties.
A piece of new knowledge for all of you through this Indodax Academy platform? Like the parable above, when we want to dive into the ocean, we must understand from A-Z the technique and the tools used.
After understanding the various meanings of candles, are you more confident about trading crypto? In the future, if you want to buy coins or issuers, there are only two choices, bye or buy!
 Market

