In this world, we need to invest some of our money, whether in gold or other financial instruments, and one of the recommendations is investing in crypto assets.
Investment is allocating assets or goods to generate income or appreciation. Appreciation refers to an increase in the value of an asset over time.
When someone buys goods as an investment asset, the goal is not to consume the item but to use it in the future to save wealth.
Investing may sound complicated and challenging, but it can be a rewarding and profitable experience with the right knowledge and tools!
When you invest in digital assets such as crypto, several indicators can help you make the right decision.
The double-bottom chart pattern is one of the most important indicators investors use to analyze price movement trends from time to time.
Trend changes in this pattern will form a buy signal for investors who want to buy assets.
This time, INDODAX Academy will discuss simple reading steps for double-bottom patterns.
Come on, know this pattern, and understand how to identify accurate trend reversal signals on the price chart!
What is the Double Bottom Pattern?
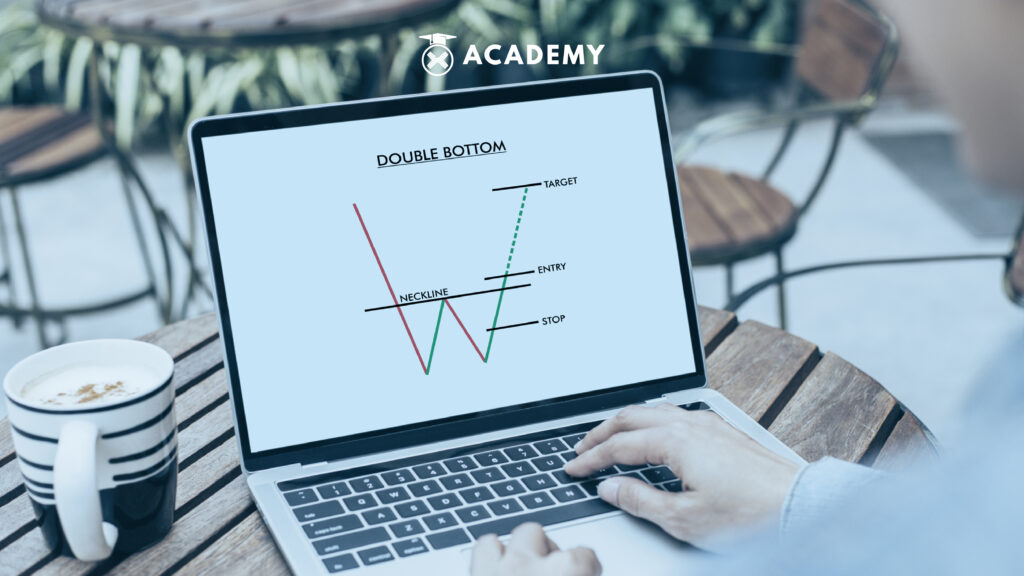
The Double Bottom Pattern is a technical analysis chart pattern indicating a trend change from a downtrend to an uptrend.
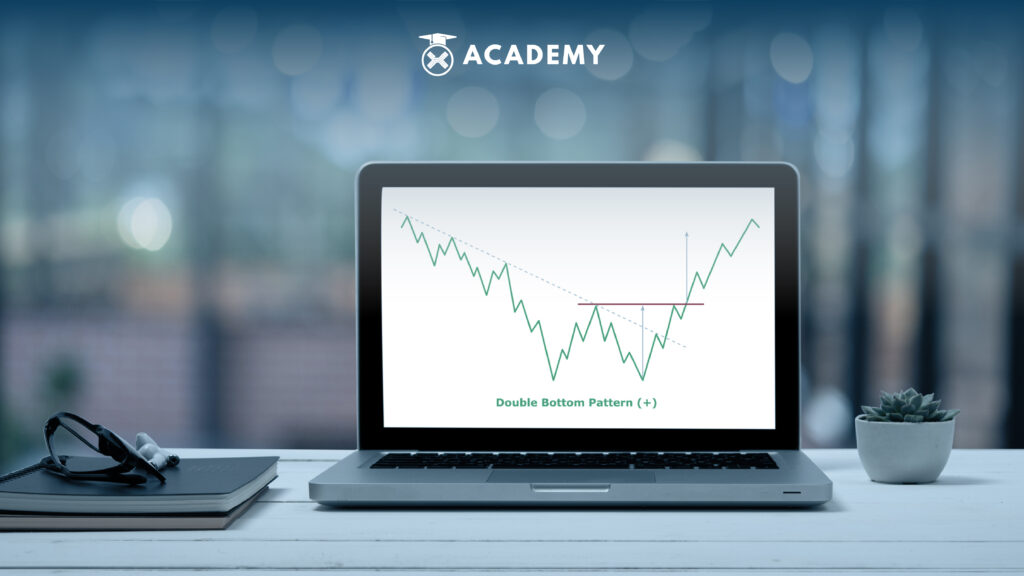
This chart pattern consists of two successive troughs that form a “W” shape. It is usually considered a bullish reversal pattern and can indicate the end of a downward trend in the market.
The Double Bottom pattern has certain characteristics that make it easy for investors to recognize and use in their trading strategy.
This usually occurs after a prolonged downtrend and signals the start of a new uptrend in the market.
Trading volume decreases when the price approaches the second trough and increases when the price increases.
The double-bottom pattern helps investors identify potential entry points into long positions and stop-loss points for short positions.
In addition, it can also be used to determine potential profit targets when entering long positions or exit points when exiting short positions.
The function of the double bottom pattern in investing is as a tool to help investors predict changes in price trends.
This W-shaped pattern tracks the downward movement in a security’s price.
Terms of the Double Bottom Pattern
To correctly identify the double bottom pattern, certain requirements must be met.
First, the two valleys must be separated by an intermediate peak higher than the two.
Second, the troughs separated by peaks must have existed for at least three months and have a minimum price gap between the two troughs of 10%.
Finally, the volume will decrease as the price approaches each trough and increase as it moves away from it.
Apart from that, you must also pay attention to the following before using the double bottom pattern.
Even though it seems obvious, an investor or trader must wait for confirmation that the price has broken the peak level between the two troughs before deciding to buy a crypto asset.
Increased trading volume when the price breaks a peak can strengthen a buy signal.
How to Read the Double Bottom Pattern

Traders use the double-bottom pattern to identify potential buying opportunities in the market.
You need to identify trend reversal signals to read the double bottom pattern.
Look for two valleys with the same price on the asset’s price chart you want to analyze. Make sure the second valley is lower than the first valley.
Then identify the peak that separates the two valleys by looking for the peak that forms between the two valleys.
Confirmation of the level indicates demand has increased as it is expected to rise until the price breaks the top level between the two troughs.
Next, make sure the trading volume shows a decreasing trend when the price approaches the second trough and increases when the price goes up. This can strengthen the buy signal.
Once the price has broken a peak, identify support and resistance levels above and below the current price.
Finally, set a stop loss below the support level to protect your investment position.
For example, here is the use of the double bottom pattern on the price chart:
You want to analyze the price chart of the crypto asset ABC. You see two valleys from several time frames that you choose to see the price at the end of the trend, which is commonly called a price reversal.
Once the double bottom has been formed, you can buy the ABC crypto asset when the price breaks the Resistance line.
Then You can place a stop loss below the support level in the double bottom pattern.
You can also look at the trading volume to determine whether it will increase or decrease.
If volume increases, it is possible that an indication of a double bottom pattern is formed or can be declared valid.
After that, the price of crypto asset ABC started to rise and reached the next resistance level, which was higher.
Advantages and Disadvantages of Using the Double Bottom Pattern
There are several advantages of using the double-bottom pattern method in the crypto market, especially in signaling the beginning of a trend reversal.
The double-bottom pattern can provide a useful initial signal for investors to go long and profit from positive price movements.
Investors can pay attention to whether the price can form two valleys at the same support level and whether the price will increase after the neckline is penetrated.
A trend reversal is likely if the price rises after breaking the neckline.
In addition, this pattern is easy to identify on the price chart, which makes it easier for investors to use the double pattern as a technical analysis tool.
The Double Bottom Pattern can also indicate price support and resistance levels, which can help investors determine stop loss and take profit levels in trading.
The Double bottom pattern can indicate price support and resistance levels. This pattern helps investors determine stop loss points and when to take profit in trading.
When the price has reached the desired profit target, investors can sell the asset or hold their position and shift the stop loss to a higher level.
When the price reaches the desired profit target, investors can sell the asset or hold their position and shift the stop loss to a higher level.
The double bottom pattern is formed when the price twice reaches the same support level. If the price breaks the resistance level, this can confirm a trend reversal from a downtrend to an uptrend.
However, investors must consider the support level formed to avoid false breakouts.
As a graphic pattern, besides having advantages, the double bottom pattern also has limitations and risks.
This chart pattern is only sometimes accurate and can give investors false signals.
The double bottom pattern also only sometimes occurs on all asset price charts, so investors can only sometimes use this pattern as a reference in making investment decisions.
The price movement of these patterns can be influenced by external factors such as news and market events, which can disrupt chart patterns and give wrong signals to investors.
However, even though this chart pattern has risks or limitations, there are also ways to avoid double-bottom mistakes.
To avoid false signals, you can confirm with other factors, such as trading volume and other technical indicators.
Set proper stop loss levels to protect your investment positions from heavy losses.
Pay attention to external factors such as news and market events to account for market risk and avoid wrong investment decisions.
How to Use the Double Bottom Pattern in Investments

The double bottom pattern is a trading tool to identify trend reversal signals.
In the double bottom pattern, investors can place buy orders after the price breaks the neckline or the resistance level formed after this pattern is confirmed.
Investors can combine the double-bottom pattern with technical indicators as part of a more comprehensive technical analysis.
Such as moving averages, relative strength index (RSI), and others to strengthen analysis and increase the accuracy of trend reversal signals.
Investors also use the double bottom pattern to avoid investment risk by setting a stop loss level at the support level formed after this pattern is confirmed.
Investors can close positions to avoid further losses if the price drops below the support level.
Before deciding to trade, investors must wait for confirmation of this chart pattern.
Confirmation can be obtained after the price breaks the neckline or the resistance level formed after this pattern.
Always pay attention to risk management when using the double bottom pattern in investments.
Set the right stop loss level to avoid big losses, and set realistic profit targets to maximize your profits.
In using the double bottom pattern in investing, it is important always to carry out a comprehensive analysis and pay attention to risk factors.
Conclusion
In Recognizing this pattern, investors can pay attention to several characteristics, such as two valleys that form at the same support level, a neckline that forms between the two valleys, and trading volume that increases when the neckline is broken.
Using the double bottom pattern in investing can help investors identify trend reversal signals and strengthen the technical analysis.
The main benefit of this double-bottom pattern is that it provides a possible reversal signal after a downtrend; this can help investors identify potential entry points to make crypto purchases.
However, to develop skills in reading the double bottom pattern, investors are advised to pay attention to the factors that influence it.
These patterns should be used with other technical analysis tools, such as trend indicators, trading volumes, and support or resistance levels, to confirm reversal signals and reduce the risk of prediction errors.
By paying attention to these factors, investors can read the double bottom pattern more comprehensively and increase the chances of success in their investments.
After reading the discussion about the double bottom pattern starting from understanding how to use it.
Now is the time for you to start investing in crypto assets at Indodax by buying on the Indodax market, and you can also learn crypto at INDODAX Academy.


