In the world of trading, the skill that a trader must have is knowing the signals of trend reversal and continuation.
The use of candle patterns is a price action analysis that you can use to find out these signals.
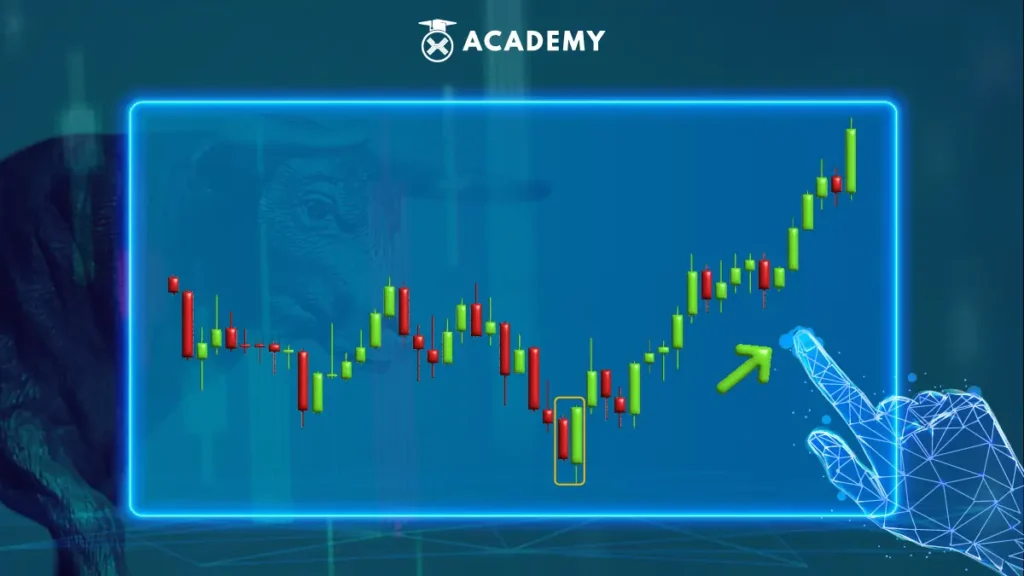
The bullish engulfing candlestick pattern is a signal for determining trend direction, usually considered a price reversal signal because it is often found at the end of a downtrend.
Meanwhile, this candlestick pattern can be used as a continuation signal to determine support areas, as long as there is a combination with other tools.
What is Bullish Engulfing?
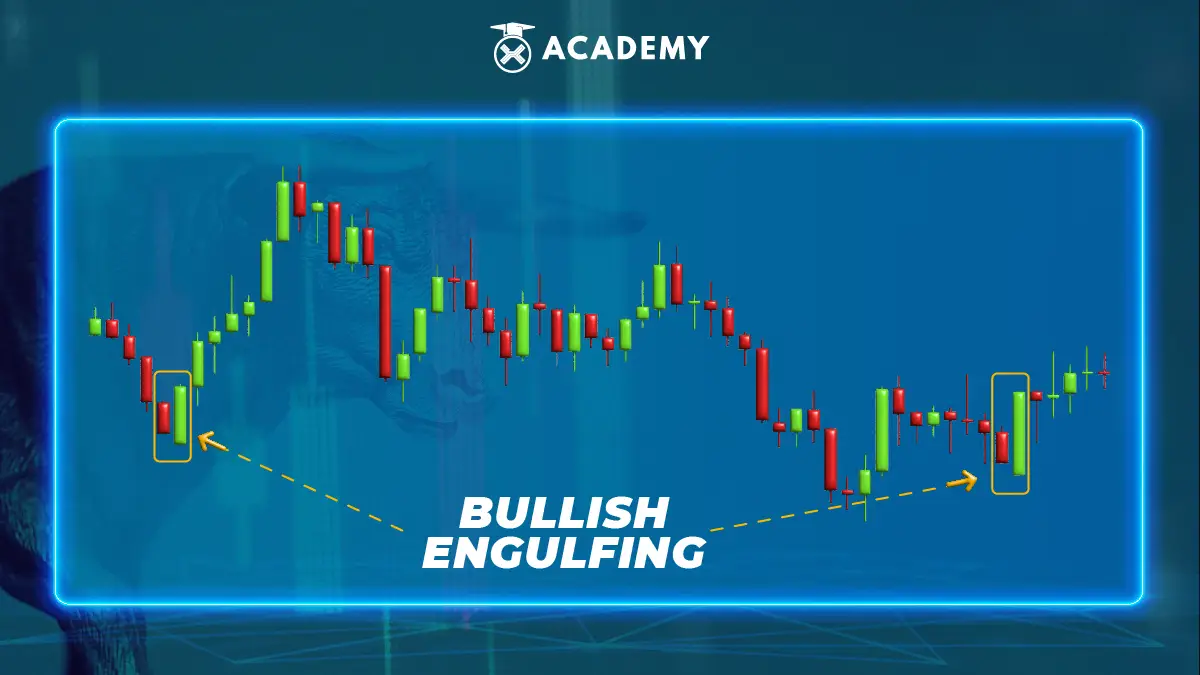
A bullish engulfing pattern is a price reversal pattern that occurs when a red bearish engulfing pattern is closed by a larger green bullish candlestick.
This shows that the buyer has taken over control of the seller, and it is very likely that the price will increase.
This candle pattern usually occurs at the end of a downtrend and is often seen as a signal point for a reversal from a downward trend to an increasing trend.
How to Recognize Bullish Engulfing When Trading

How to recognize bullish engulfing when trading easily as long as you know its characteristics.
By understanding it, you can benefit from a potential entry level.
Overall, Bullish engulfing is characterized by a solid green candlestick that can completely engulf the previous red candlestick and usually occurs at the bottom of a downtrend.
In addition, the trend reversal signal will be stronger if the red candle is a doji candle as the confirmation. The candle inside the bar is a sign of a reversal candle reversal of the trend.
Talking about doji candles, you can read articles about dragonfly doji, where this type of candle will help traders see where support and demand are.
The difference between Bullish Engulfing and Bearish Engulfing
There are two types of engulfing candlestick patterns, namely bullish and bearish. The bearish engulfing pattern is the opposite of the bullish engulfing pattern.
This pattern also appears at an uptrend’s highs and signals traders when to sell.
The bullish engulfing pattern is characteristic of a green candlestick swallowing the previous red candlestick. Its location appears at the bottom of a downtrend. A bullish signal is a bullish reversal.
The bearish engulfing pattern resembles a red candlestick swallowing the previous green candlestick. Its location appears at the top of an uptrend. For a bearish signal, that is a bearish reversal.
How to Trade Using Bullish Engulfing
One of the bullish engulfing candlestick patterns does not need the help of indicators or other tools.
If the market is in a downtrend and then a bullish engulfing pattern appears in the lowest price area, you can use this pattern directly if it adheres to the abovementioned characteristics.
This pattern is displayed in a downward trend. The candlestick then validates the signal when it closes above the higher level of the bullish candle. The stop feature can be set when it is below the low level of the bullish engulfing candlestick pattern.
With the target set at a key level, the price has reversed.
Of course, this is a new swing high and provides a positive risk-to-profit ratio.
How to Look for Buy Signals Using Bullish Engulfing
If you already know the direction of the trend, of course, you can use candlestick patterns on price movements in the Higher Low area for an uptrend, Lower Low for a downtrend, and in the support area.
Red candles for bearish engulfing better avoid buying. Then, the bullish engulfing candle you can buy when there is confirmation. You can use it under the bullish engulfing candle body to stop loss.
Conclusion
Bullish engulfing is a candlestick pattern consisting of two candles. The first candle is a small bearish engulfing (red) pattern, while the second is a larger bullish engulfing (green) pattern.
Overall, Bullish engulfing is characterized by a strong green candlestick that can completely engulf the previous red candlestick and usually occurs at the bottom of a downtrend.
The bullish engulfing pattern is characteristic of a green candlestick swallowing the previous red candlestick. Its location appears at the bottom of a downtrend. A bullish signal is a bullish reversal.
You can also study it at Indodax Academy; I hope this article is helpful.
 Market

