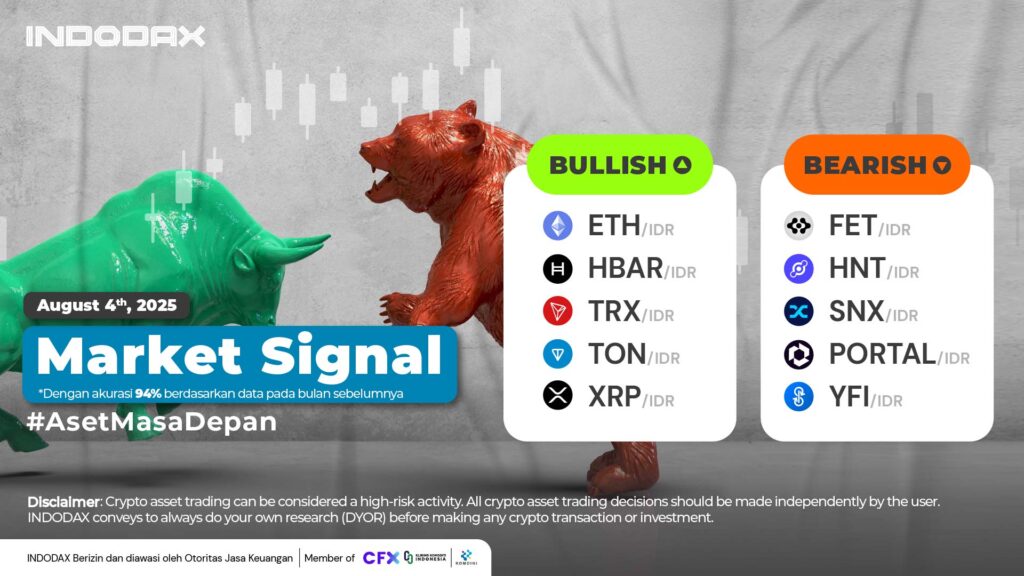
This week, the bullish crypto lineup is led by Ethereum(ETH) in first place, followed by Hedera (HBAR) and Tron (TRX) ..
Want to know how your favorite crypto asset is performing? Check INDODAX Market Signal below!
5 Aset Kripto Bullish
1.Ethereum (ETH)

The trend that was in the Overbought area on the RSI indicator was one of the things that made Ethereum (ETH) experience a correction, then supported by a trend that had not succeeded in breaking through the 63,000,000 – 65,000,000 area, negative momentum became more dominant.
2.Hedera (HBAR)

The nearest Hedera (HBAR) resistance is in the price range of 4,500 – 5,800. A breakout of this price will be positive for the Hedera (HBAR) trend change in the Bullish phase, WMA/75 will move away from EMA/200.
3.Tron (TRX)

The price is slowly strengthening positively, the MACD indicator does not show anything in line with the two lines, it has not shown confirmation of the direction of the Tron (TRX) trend movement, the candlestick’s persistence above the 5,500 – 6,500 area has a positive impact on the change in the Tron (TRX) trend.
4.Toncoin (TON)

The price is slowly strengthening positively, the MACD indicator does not show anything in line with the two lines, it has not shown confirmation of the direction of the Tron (TRX) trend movement, the candlestick’s persistence above the 5,500 – 6,500 area has a positive impact on the change in the Tron (TRX) trend.
5.XRP (XRP)

XRP’s 1-day trend is negative, with the MACD indicator crossing downwards, and the price reacting negatively. The nearest XRP support level is located in the 36,000-42,000 area.
5 Bearish Crypto Assets
1.Artificial Superintelligence Alliance (FET)

A breach of the 15,000-20,000 resistance level will negatively impact the Artificial Superintelligence Alliance (FET) bearish trend, by causing the bearish trend to become suppressed, thus increasing the possibility of a bearish turn to bullish.
2.Helium (HNT)

The trend will reverse to positive with the penetration of the Resistance area of 70,000 – 90,000, several indicators will follow the change, the MACD indicator will most likely be positive with both lines crossing upwards followed by a Candle that stays above the EMA/200.
3.Synthetix (SNX)

The trend moves in the Sideways Bearish phase causing the price to move in a fairly limited range of 8,000 – 15,500, passing one of the prices will have an impact on changes in the MACD indicator where the trend that breaks through the Resistance of the two MACD lines will move
4.Portal (PORTAL)

The 1 Day chart shows that Portal (PORTAL) has not experienced significant price changes, the price is stagnant, with no negative or positive momentum being a factor. Currently, the price is moving in the range of 450 – 1,050.
5.yearn.finance (YFI)

The Downtrend phase is likely to fail to continue with the penetration of the Resistance area of 99,000,000 – 110,000,000 with the Trend moving stronger towards the next Resistance at the level of 125,000,000 – 145,000,000.
NOTE: If the 5 EMA crosses the WMA 75, 85 and 200 EMA lines and the lines intersect from the bottom up, then the market trend tends to go up (bullish), each table above shows that if the 5 EMA value is higher than the 75.85 WMA and 200 EMA, the market tends to go up (bullish).
If the RSI and MACD values ??show the same condition, it means that the market is showing the same trend. Overbought or oversold conditions are an indicator that the market is already at the point of changing direction of a trend.
ATTENTION: All contents which includes text, analysis, predictions, images in the form of graphics and charts, as well as news published on this website, is only used as trading information, and is not a recommendation or suggestion to take action in transacting either buying or selling. certain crypto assets. All crypto asset trading decisions are independent decisions by the users. Therefore, all risks arising from it, both profit and loss, are not the responsibility of Indodax.
 Market