Happy early July, Indodax friends! At the beginning of this month, there were several coins in the Indodax market signal that could be recommended and could help the portfolio go green again. Let’s find out here!
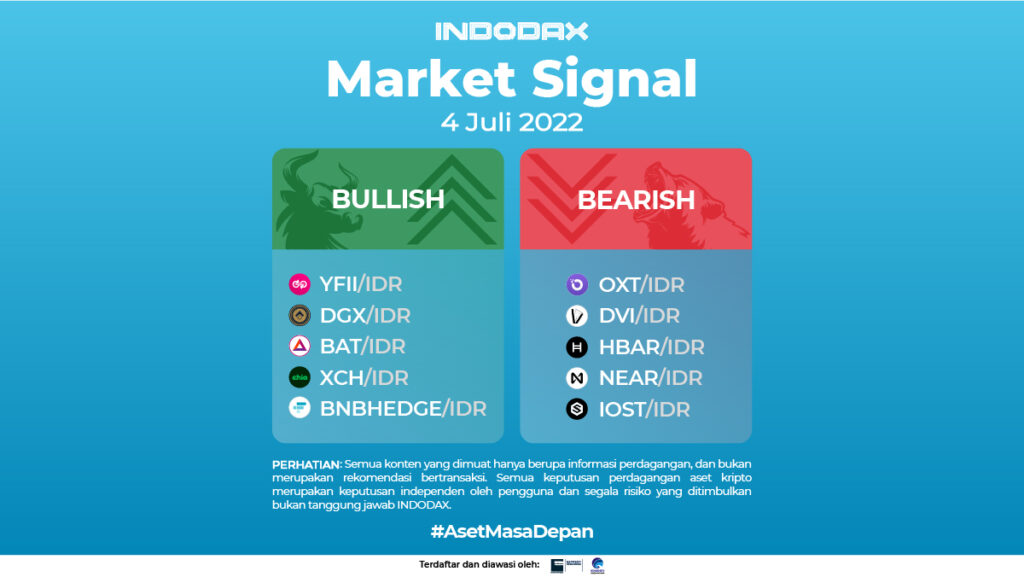
5 Bullish Crypto Assets
- DFI.Money (YFII)
The increase in the DFI.Money (YFII) trend occurred on June 25, 2022, the trend was able to survive and create a candle at the price of 12,500,000. The price had jumped quite sharply to touch the price area of 15,710,000, but the price was unable to continue strengthening and experienced a correction when the RSI indicator was in the Overbought area.

The trend that occurs still indicates that it is still on the Uptrend Channel and above the EMA/200 line. The trend will try to break through the resistance level at the price of 16,000,000 but there are several wicks that occur on the YFII candle which proves that the buying level is quite massive.
The bullish phase can be confirmed as cancelled to continue if the price is able to move to break the price at the support level of 12,000,000 but before going to this level, the price must be able to break through the support level in the range of 12,700,000.
- Digix Gold Token (DGX)
Had experienced a deep enough weakness and entered the Bearish phase but was gradually able to reverse the direction of price movement such as being able to break through the 500,000 resistance level, holding above the 600,000 price which was able to push and change the trend that was previously in the Bearish phase into a Bullish phase .

In the 4 hour time frame it can be seen that quite often there is a long wick on the candle. The bulls will try to break through the 760,000 price level, meanwhile the downside will try to reach the 650,000 price which the next price level will be in the 600,000 range.
- Basic Attention Token (BAT)
On June 30, 2022, the price movement suddenly experienced a spike accompanied by not being able to penetrate the resistance level of 5.750 so that the price experienced a correction but the Bullish phase continued because the price was unable to pass the price level of 5.280 and the price continued to strengthen.

The MACD indicator illustrates if the price direction is still in the positive histogram area with a positive zone. The support level is in the range of the EMA/200 line at the price of 5,700, a break of this level will open the opportunity to go to the 5,150 price level.
- Chia Network (XCH)
In the 4-hour chart time, the movement of Chia Network (XCH) was previously in a Bearish phase but on 22 June 2022 managed to break the resistance level of 550,000 so that it entered a Bullish phase. The uptrend channel can be confirmed not to continue the trend if the price is able to break the support level of 580,000 and also the price of 520,000.

The MACD indicator shows that the price is currently in a negative direction after a downward crossover. Bullish sideways are happening with price movement around the 610,000 – 690,000 range, a break of one of the lines will confirm the direction of the next price movement.
- 1X Short BNB Token (BNBHEDGE)
In the use of the 1-Day time frame, it can be seen if the price tested the EMA/200 line level at the price range of 110,000 but failed to break through this level so that the price bounced back and continued to strengthen and even broke the resistance level of 130,000. The MACD indicator shows that if the current trend is in the negative area, the weakening will test the support level at around 143,000. If this level is broken then it will move towards the 135,000 level.

The Bullish trend will continue if BNBHEDGE does not break or remains above the 120,000 price level, if the candle is able to form above the 162,000 price range it will open an opportunity to form a new direction in the Uptrend phase.
5 Bearish Crypto Assets
- Orchid (OXT)
The decline has occurred since January 10, 2022 which was further confirmed by the break of the support level which was strong enough at the price of 4,940 so that it entered the Bearish phase, the weakening of which had occurred to touch the lowest price since January 23, 2022. The MACD indicator shows a trend that is in a positive phase.

The support level is in the 1,300 – 1,400 price range and if it strengthens, it will further test the 1,700 price level, a break of the resistance level will open an opportunity for an improvement in the trend direction which will then move towards the 2,000 price level.
- Division Network (DVI)
On the 1-Day chart the DVI candle shows a Bearish trend, the price was unable to break through the WMA/75 and WMA/85 lines so that the price continued to weaken, there was a fairly strong support level at the price range of 1,000. The RSI indicator has touched the oversold area and is currently away from that area, but this is not in line with the price direction, thus opening the opportunity for a correction.

The resistance level is in the 2,000 price range, an indication that the price will continue to strengthen if the Division Network (DVI) is able to breakout from WMA/75 and WMA/85.
- Hedera Hashgraph (HBAR)

Hedera Hashgraph (HBAR) has entered the Bearish zone since January 14, 2022 where the candle chart was unable to stay above the EMA/200, WMA/75 and WMA/85 and the support level was broken at 5,000. The Bollinger Bands indicator shows that the area is open, which means the price will be quite volatile. The price decline in HBAR has been deep enough, as evidenced if on June 18, 2022 it touched the lowest price while trading on Indodax. Price conditions will be in a better direction if they are able to break through the resistance level at 1,300.
- NEAR Protocol (NEAR)
The broken EMA/200 line made the price of the NEAR Protocol (NEAR) experience a deep decline, the red candle that was formed quite strong and long on 11 May 2022 indicates that the selling level is very dominating compared to the buying level, which also makes a strong support level at price range 115,000-122,000 penetrated.

The MACD indicator for 1 day shows that the trend is in a positive area, meanwhile the direction of the NEAR price is still trying to penetrate the 65,000 price level which if this level is broken it will open an opportunity to strengthen and test the 86,000 price level.
- IOST (IOST)
On March 31, 2022, IOST crossed the EMA/200 level and touched 790 but was unable to continue strengthening, because the 1-Day chart showed that the RSI indicator was in the Overbought area so that the price was corrected again.

The trend is still indicated to be in the Bearish range, below the EMA/200 line. The support level is at the price of 150, meanwhile the resistance level is at the level of 280. The bearish area will end if the candle is able to break through the 420 price level and the strong resistance level at the 540 price.
NOTE: Jika EMA 5, melewati garis WMA 75, 85 dan EMA 200 dan garis tersebut berpotongan dari bawah ke atas, maka tren market cenderung naik (bullish),
di tiap tabel di atas menunjukkan apabila, nilai EMA 5 lebih tinggi dari WMA 75,85 dan EMA 200 maka market cenderung naik (bullish).
Apabila nilai RSI dan MACD menunjukkan satu kondisi yang sama, berarti market menunjukkan tren yang sama, kondisi overbought (jenuh beli), atau oversold (jenuh jual), adalah salah satu indikator bahwa market sudah berada di titik pergantian arah tren.
PERHATIAN : Semua konten yang mencakup teks, analisis, prediksi, gambar baik berupa grafis maupun chart, serta berita yang dimuat di website ini, hanya digunakan sebagai informasi perdagangan belaka, dan bukan merupakan anjuran atau saran untuk melakukan sebuah tindakan dalam bertransaksi baik membeli atau menjual aset kripto tertentu. Semua keputusan perdagangan aset kripto merupakan keputusan independen oleh pengguna. Oleh sebab itu, segala risiko yang timbul karenanya, baik untung maupun rugi, bukan menjadi tanggung jawab Indodax.
 Market

