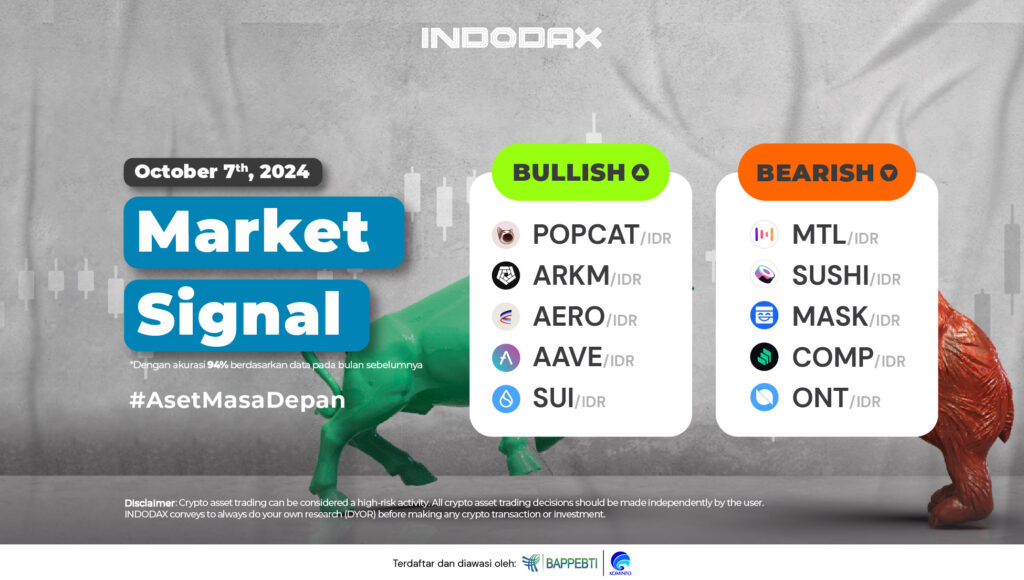
This week, the bullish crypto lineup is led by Popcat (POPCAT) in first place, followed by Arkham (ARKM) and Aerodrome Finance (AERO).
Want to know how your favorite crypto asset is performing? Check INDODAX Market Signal below!
5 Bullish Crypto Assets
1. Popcat (POPCAT)

The rise of Popcat (POPCAT) can be attributed to the price breaking above the EMA/200 line at the 9,000 – 12,000 range. A bullish channel drove the price upward, with one significant instance occurring on October 6, 2024, when Popcat (POPCAT) reached a price level of 23,000, its highest since being listed on Indodax.
2. Arkham (ARKM)
The two lines of the Bollinger Bands indicator are widening, indicating that the price is likely to become more volatile. The trend direction in the Bullish phase is tending to strengthen, with candles forming and holding above the 25,000 – 30,000 resistance level.
3. Aerodrome Finance (AERO)

On the 4-hour chart, the RSI indicator shows that the price of Aerodrome Finance (AERO) is not yet in the Oversold area, which is normal as the price is still held back by the Resistance area of 20,000 – 24,000. Meanwhile, the MACD indicator remains in the positive zone with a positive histogram.
4. Aave (AAVE)

After successfully breaking through the 1,650,000 – 1,900,000 level, supported by a candle that managed to hold above this level and entered the Bullish zone, the rise of Aave (AAVE) has been quite positive, increasing by around 40% from the start of the Bullish phase until now.
5. Sui (SUI)

Currently, Sui (SUI) is holding above the WMA/75, which is a positive sign for Sui (SUI) to continue strengthening in the uptrend phase. The strengthening trend is expected to materialize as the MACD indicates a similar pattern, with positive momentum likely dominating the price movement.
5 Bearish Crypto Assets
1. Metal DAO (MTL)

The trend has weakened and is confirmed to be in the Bearish phase after failing to hold above the 20,000 – 25,000 area. Metal DAO (MTL) experienced a price drop of over 40%. However, the candle formed above the 20,000 – 27,500 level suggests that Metal DAO (MTL) may strengthen again.
2. SushiSwap (SUSHI)

In the 1-day time frame, SushiSwap (SUSHI) has been in a Bearish phase since June 13, 2024. It briefly held above the EMA/200 line, but the candle was unable to break through the price level of 19,750 – 20,500.
3. Mask Network (MASK)

A Bearish trend can be confirmed as failing to continue if the price is able to strengthen and hold above the WMA/75 and WMA/85 lines, followed by a breakout above the Resistance level at prices of 58,000 – 70,000. Meanwhile, if a decline occurs, the trend will attempt to create a candle below the 25,000 – 30,000 level.
4. Compound (COMP)

The decline began when the price trend was unable to sustain above the price level of 900,000 – 1,020,000, resulting in a break below the EMA/200, and on June 17, it entered the Bearish zone. The trend in the Bearish zone will be broken if the price is able to break through the price level of 1,100,000, followed by a candle forming above the EMA/200 line.
5. Ontology (ONT) ??

The MACD indicator suggests that Ontology (ONT) is moving in a negative direction, but if the price can hold above the area of 800,000 – 1,000,000, it will increase the chances for Ontology (ONT) to strengthen and correct the current trend weakness.
NOTES: If the EMA 5 crosses the WMA 75, WMA 85, and EMA 200 from below to above, then the market trend is likely to rise (bullish).
In each table above, if the value of EMA 5 is higher than WMA 75, WMA 85, and EMA 200, then the market is likely to be bullish.
If the RSI and MACD indicators show the same condition, it means the market is displaying the same trend. Conditions of overbought or oversold are indicators that the market is at a turning point in the trend.
ATTENTION : All content including text, analysis, predictions, images in the form of graphics or graphs, and news contained on this website, are only used as trading information, and are not recommendations or suggestions to take action in transactions, either buying or selling certain crypto assets. All crypto asset trading decisions are independent decisions by the user. Therefore, all risks arising from it, both profits and losses, are not the responsibility of Indodax.


 Polkadot 8.79%
 BNB 0.53%
 Solana 4.77%
 Ethereum 2.37%
 Cardano 1.75%
 Polygon Ecosystem Token 2.10%
 Tron 2.85%
 Market


