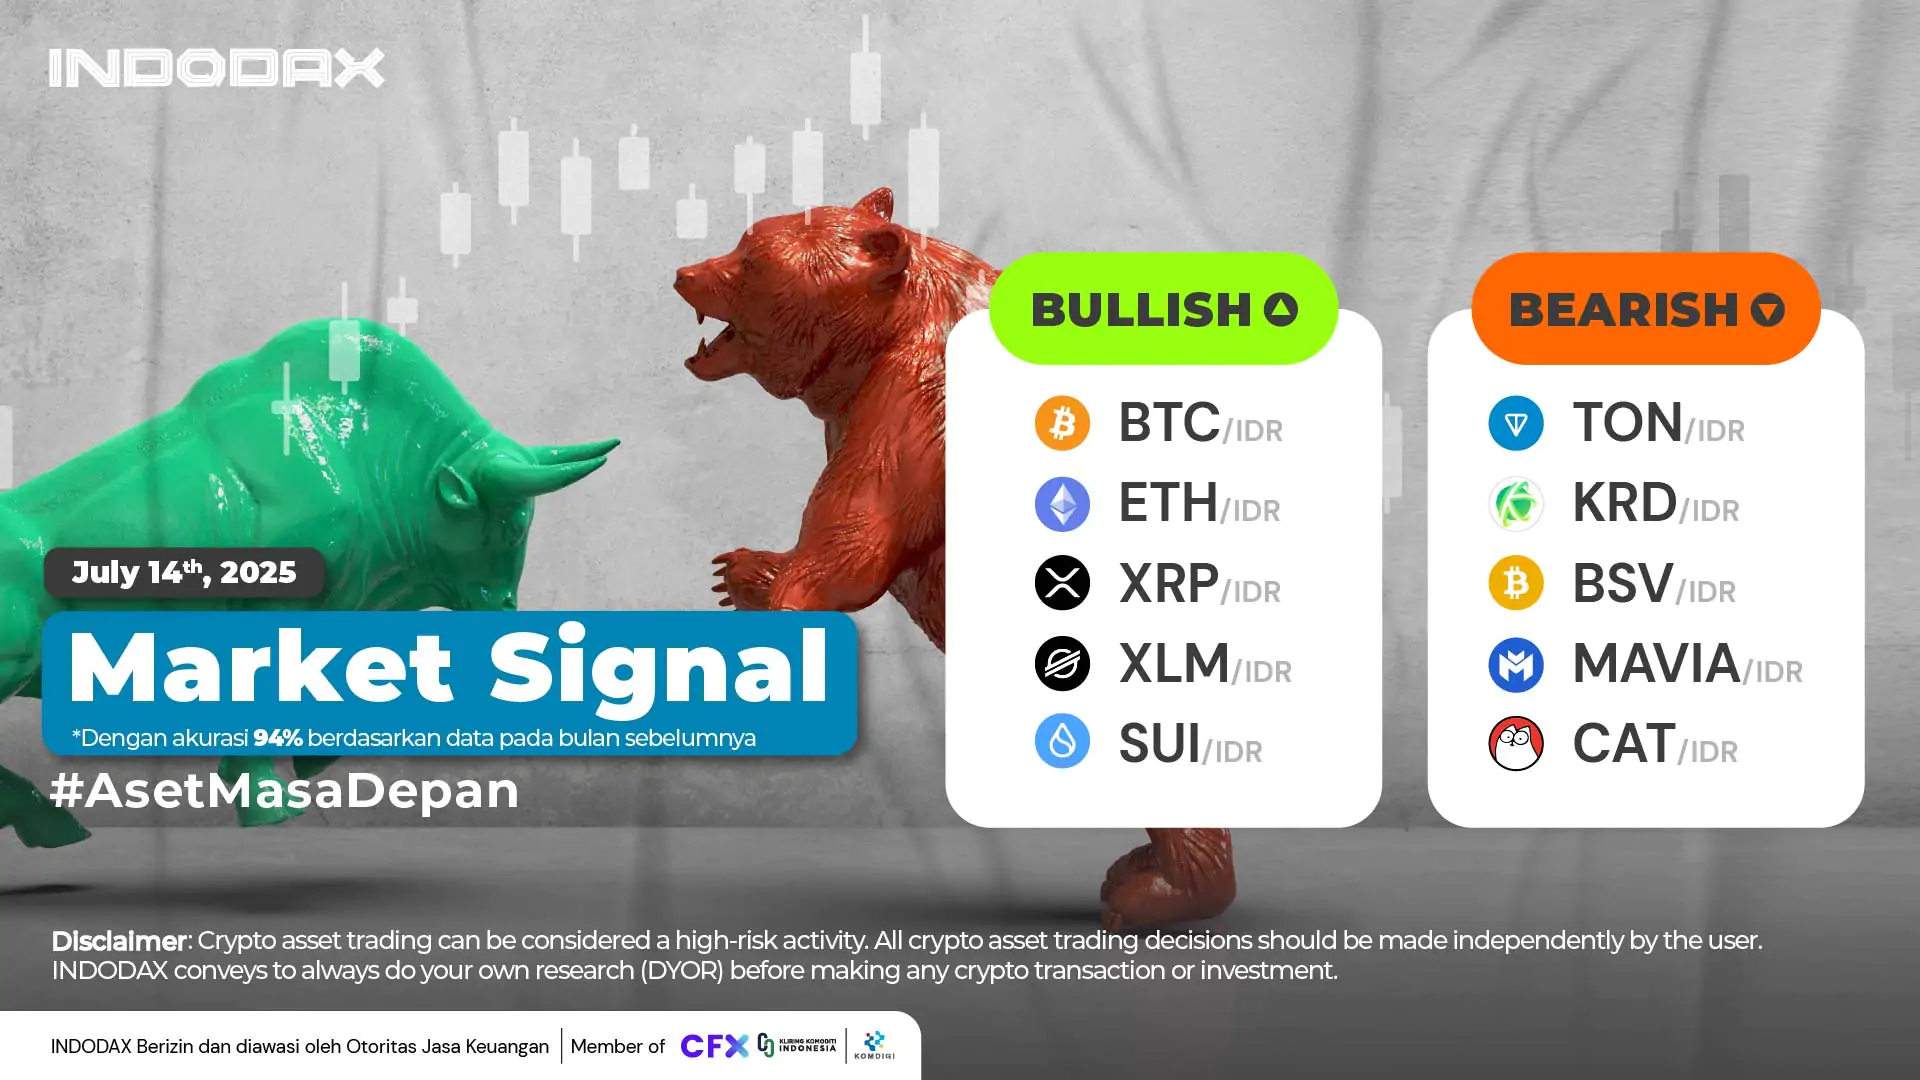
This week, the bullish crypto lineup is led by BITCOIN(BTC) in first place, followed by Ethereum(ETH) and XRP(XRP).
Want to know how your favorite crypto asset is performing? Check INDODAX Market Signal below!
5 Bullish Crypto Assets
1.Bitcoin (BTC)
 The movement of the Candle above the WMA/85 has succeeded in pushing the price of Bitcoin (BTC) to strengthen positively, Bitcoin (BTC) has succeeded in breaking the dominant Resistance of 1,700,000,000 – 1,800,000,000 making Bitcoin (BTC) make a new high price with the potential for strengthening which is quite open to continue.
2.Ethereum (ETH)
 Although the MACD indicator shows a negative crossover, the price of Ethereum (ETH) as a whole has not experienced a deep correction, Ethereum (ETH) is trying to test the strength of the Resistance in the range of 50,000,000 – 57,000,000.
3.XRP (XRP)
 The absence of a candle below the EMA/200 is an indication that XRP (XRP) has the potential to strengthen quite significantly, XRP (XRP) is moving stronger in line with the current bullish trend, with the current trend being in the overbought area on the RSI indicator.
4.Stellar (XLM)

Starting with a trend depicted by the MACD indicator cutting upwards, indicating a positive movement in the Stellar (XLM) trend, it then moved stronger until it passed the Resistance of 4,000 – 5,500, becoming a turning point for Stellar (XLM) to move into a Bullish phase.
5.Sui (SUI)

On the 4-hour time frame, Sui (SUI) is indicated to be in an uptrend direction. The price strengthening direction will continue to be stronger if the candle is able to stay above the 60,000-70,000 level, which will have a positive impact on the bullish trend which will continue to dominate.
5 Aset Kripto Bearish
1.Toncoin (TON)
 Failure to maintain the candle above the support of 30,000 – 45,000 will have a negative impact on the price of Toncoin (TON) which has the opportunity for Toncoin (TON) to touch its latest low price, on the other hand, breaking through Toncoin (TON) in the area of 55,000 – 70,000 has a positive impact on improving the bearish trend.
2.Krypton DAO (KRD)
 The movement of Krypton DAO (KRD) is currently being held back by the WMA/75 so that Krypton DAO (KRD) moves in a limited manner, Krypton DAO (KRD) will move more fluctuatively with the trend of 290 – 400 being broken.
3.Bitcoin SV (BSV)
 Bitcoin SV (BSV) is moving below the WMA/85, causing negative pressure on the price. The price of Bitcoin SV (BSV) will move in a positive direction with the 600,000-800,000 area being broken, followed by a candle moving above the EMA/200.
4.Heroes of MAVIA (MAVIA)
 The price decline of Heroes of MAVIA (MAVIA) is likely to be corrected, but the trend must be able to move above the WMA/85, then the price is expected to move to test the 6,000 – 8,000 area.
5.Simon’s Cat (CAT)

The absence of significant movement means that Simon’s Cat (CAT) does not experience significant price changes. Currently, Simon’s Cat (CAT) needs more time to confirm the direction of the trend movement. Failure to maintain above the 0.07 – 0.1 area will make the Bearish trend even stronger.
NOTE: If the 5 EMA crosses the WMA 75, 85 and 200 EMA lines and the lines intersect from the bottom up, then the market trend tends to go up (bullish), each table above shows that if the 5 EMA value is higher than the 75.85 WMA and 200 EMA, the market tends to go up (bullish).
If the RSI and MACD values ??show the same condition, it means that the market is showing the same trend. Overbought or oversold conditions are an indicator that the market is already at the point of changing direction of a trend.
ATTENTION: All contents which includes text, analysis, predictions, images in the form of graphics and charts, as well as news published on this website, is only used as trading information, and is not a recommendation or suggestion to take action in transacting either buying or selling. certain crypto assets. All crypto asset trading decisions are independent decisions by the users. Therefore, all risks arising from it, both profit and loss, are not the responsibility of Indodax.
 Market