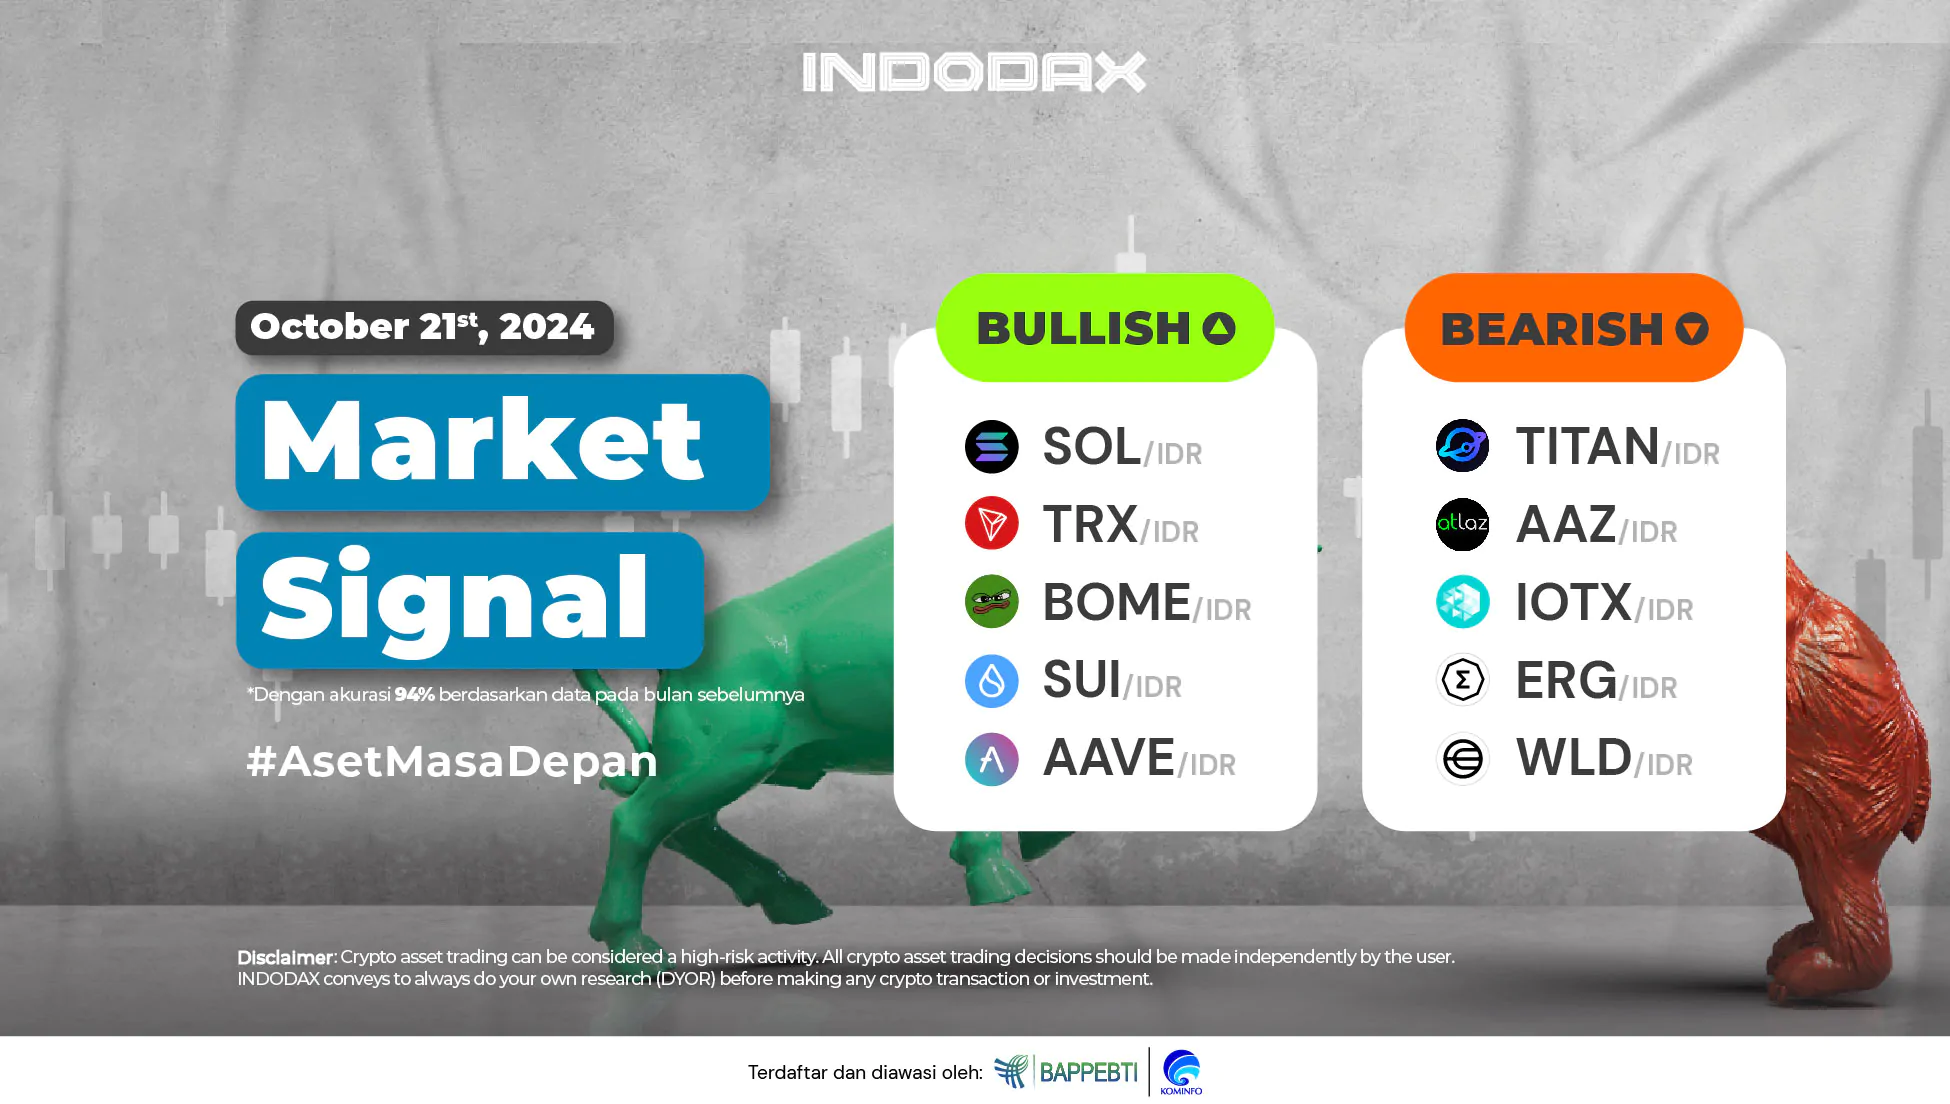
This week, the bullish crypto lineup is led by SOLANA(SOL) in first place, followed by TRON(TRX) anda BOOK OF MEME (BOME).
Want to know how your favorite crypto asset is performing? Check INDODAX Market Signal below!
5 Aset Kripto Bullish
1.Solana (SOL)

A positive trend has made the price of Solana (SOL) follow a fairly high strengthening, with this increase currently having an impact on Solana (SOL) which is in the Overbought area with RSI indicator analysis. The dominant resistance of 2,350,000 – 2,500,000 can be penetrated indicating that the momentum of Solana (SOL) is quite positive.
2. Tron(TRX)

The positive price movement of Tron (TRX), the price has strengthened in line with the movement of EMA / 5 and WMA / 75, this opens up opportunities for Tron (TRX) to be able to penetrate the Resistance area which is quite dominant in the price range of 2,525 – 2,675 which will make Tron (TRX) touch its highest price.
3. BOOK OF MEME (BOME)

The MACD indicator estimates that currently BOOK OF MEME (BOME) is moving negatively with a line that intersects downwards, but this is not directly proportional to the price of BOOK OF MEME (BOME) which continues to strengthen and currently the trend is still able to stay above WMA / 85.
4.Sui (SUI)

The fairly high price strengthening has driven the Sui (SUI) trend to change, which has now succeeded in confirming a change to Bullish with EMA / 200 being cut by WMA / 85. Support is indicated in the area of ??22,500 – 28,000 with the price remaining above this area will increase the possibility of Sui (SUI) being able to move higher.
5. Aave (AAVE)

Currently, the Aave (AAVE) trend is above WMA/85, allowing the trend to strengthen higher. The resistance area is in the range of 2,500,000 – 3,000,000. If it is successfully penetrated, it will go to the next area of ??3,700,000 – 4,250,000.
5 Aset Kripto Bearish
1. TitanSwap (TITAN)

The 1 Day time frame indicates that TitanSwap (TITAN) has not succeeded in confirming the direction of the trend movement until now. TitanSwap (TITAN) is still in the Sideways Bearish phase, this phase will end if the Candle can form above the 30 – 40 area.
2. ATLAZ (AAZ)

Since listing on Indodax ATLAZ (AAZ) has experienced quite a high weakening, with a price strengthening of 540,000 – 600,000 will make ATLAZ (AAZ) improve the weakening trend with a price moving above EMA / 200
3.IoTeX (IOTX)

The Bearish trend will fail to continue if IoTeX (IOTX) can move above the 800 – 1,050 level with this assumption, IoTeX (IOTX) will try to continue strengthening to the next level of 1,300 – 1,500.
4.Ergo (ERG)

The negative trend of Ergo (ERG) cannot be separated from the Candle that cannot penetrate the WMA/85 so that the momentum of the reversal is not realized. Support is at around the price of 8,000 – 9,500 the lowest price of Ergo (ERG) will be formed.
5.Worldcoin (WLD)

Worldcoin (WLD) experienced a price weakening, being in the Downtrend phase on June 27, 2024, ABBC has weakened to around 40%. The current Worldcoin (WLD) trend when using the MACD indicator is in a positive phase, with a trend that can penetrate the EMA/200 allowing Worldcoin (WLD) to go to the level of 60,000 – 75,000.
NOTE: If the 5 EMA crosses the WMA 75, 85 and 200 EMA lines and the lines intersect from the bottom up, then the market trend tends to go up (bullish), each table above shows that if the 5 EMA value is higher than the 75.85 WMA and 200 EMA, the market tends to go up (bullish).
If the RSI and MACD values ??show the same condition, it means that the market is showing the same trend. Overbought or oversold conditions are an indicator that the market is already at the point of changing direction of a trend.
ATTENTION: All contents which includes text, analysis, predictions, images in the form of graphics and charts, as well as news published on this website, is only used as trading information, and is not a recommendation or suggestion to take action in transacting either buying or selling. certain crypto assets. All crypto asset trading decisions are independent decisions by the users. Therefore, all risks arising from it, both profit and loss, are not the responsibility of Indodax.
 Market