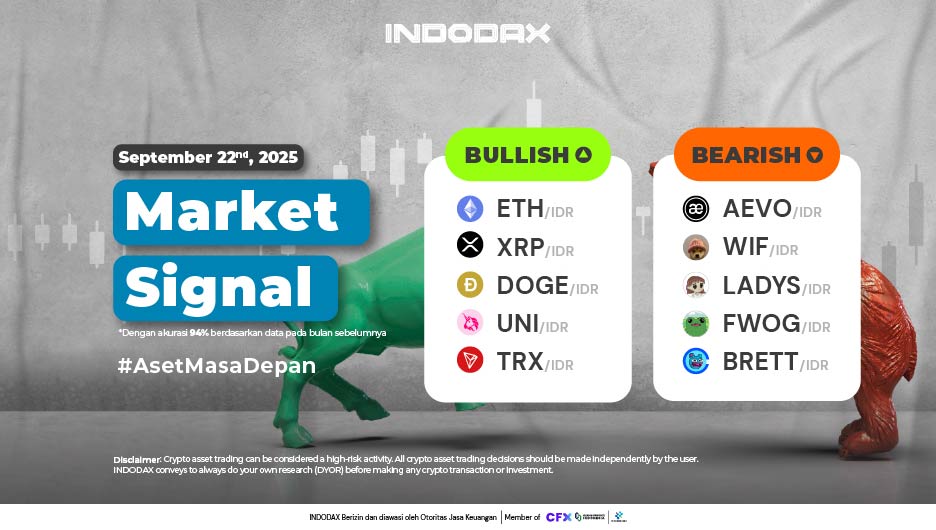
This week, the bullish crypto lineup is led by Ethereum(ETH) in first place, followed by XRP(XRP) and Dogecoin(DOGE)
Want to know how your favorite crypto asset is performing? Check INDODAX Market Signal below!
5 Bullish Crypto Assets
1.Ethereum (ETH)

Ethereum (ETH) has yet to break through its latest high, but the trend remains above the 85-day moving average (WMA). The two MACD lines are still converging, and Ethereum (ETH) needs time to confirm its next trend.
2.XRP (XRP)

On the 1 Day time frame, it can be estimated that XRP (XRP) is still in the Uptrend zone but XRP (XRP) has not experienced significant movements so that price changes are not too large.
3.Dogecoin (DOGE)

The strengthening that occurs will have a positive impact on the change in the Dogecoin (DOGE) trend, it is estimated that Dogecoin (DOGE) will stay above the WMA/85 so that the line on the MACD indicator will cross upwards.
4.Uniswap (UNI)

On the 1-Day timeframe, Uniswap (UNI) is still moving in a bullish phase, but this phase will fail to continue with the breakout of the 80,000-120,000 support level, predicting a trend moving below the 200-EMA.
5.Tron (TRX)

The absence of a significant price increase or decrease indicates that Tron (TRX) has not yet been able to penetrate the Resistance zone or weaken beyond the Support area.
5 Bearish Crypto Assets
1.Aevo (AEVO)

Aevo (AEVO) briefly strengthened above the 200-day moving average (EMA/200), but this was short-lived, with the RSI indicator indicating it was entering the overbought zone. A trend correction will occur if Aevo (AEVO) successfully breaks through 3,000-5,000.
2.dogwifhat (WIF)

On the 1-Day chart, the strengthening of the dogwifhat (WIF) failed to penetrate the EMA/200. The bearish trend continues with the price testing the strength of the 10,000-14,000 area. A breakout of this area will make the indicator line on the MACD indicator confirm a negative trend.
3.Milady Meme Coin (LADYS)

The trend movement below WMA/75 makes Milady Meme Coin (LADYS) experience negative pressure, touching Milady Meme Coin (LADYS) below the price of 0.0004 indicates that Milady Meme Coin (LADYS) has touched the latest lowest price.
4.Fwog (FWOG)

Having strengthened and moved above the EMA/200, FWOG (FWOG) failed to penetrate the Resistance area of ??730 – 800, then FWOG (FWOG) weakened again and returned to the Bearish phase.
5.Brett (BRETT)

The Bearish trend will increasingly dominate price changes, Brett (BRETT) failed to hold above WMA/85 followed by Support 600 – 720 failed to hold back the weakening price of Brett (BRETT).
NOTE: If the 5-day moving average (EMA) crosses the 75-day moving average (EMA), 85-day moving average (EMA), and 200-day moving average (EMA) lines, and the lines intersect from bottom to top, the market trend is likely to be bullish.
Each table above shows that if the 5-day moving average (EMA) is higher than the 75-day moving average (EMA), 85-day moving average (EMA), and 200-day moving average (EMA), the market is likely to be bullish.
If the RSI and MACD values ??show the same condition, it means the market is exhibiting the same trend. Overbought or oversold conditions are indicators that the market is approaching a trend reversal point.
DISCLAIMER: All content, including text, analysis, predictions, images (graphics and charts), and news published on this website, is for trading information purposes only and does not constitute advice or recommendations to buy or sell specific crypto assets. All decisions to trade crypto assets are made independently by the user. Therefore, Indodax is not responsible for any risks arising from this, whether profit or loss.
 Market