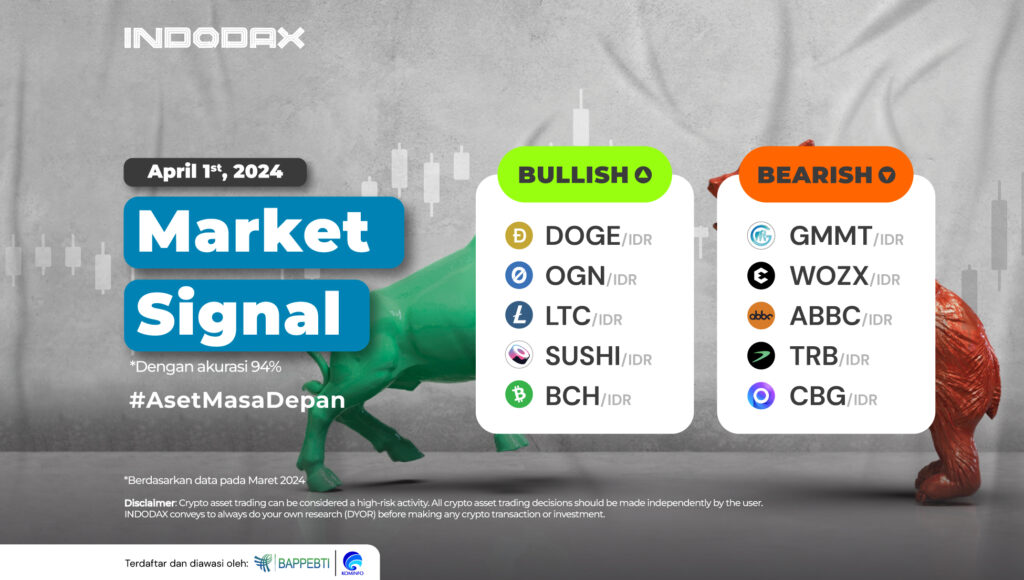
Welcoming the month of April, Dogecoin (DOGE) remains at the top of the bullish trend of crypto assets on INDODAX, followed by Litecoin (LTC) and Bitcoin Cash (BCH).
Curious about what crypto assets are experiencing bullish or bearish trends this week? Check out the full INDODAX Market Signal update below!
5 Bullish Crypto Assets
1. Dogecoin (DOGE)

Dogecoin (DOGE) has been able to strengthen quite massively, where since the resistance area of 1,300-1,650 was positively broken, Dogecoin (DOGE) has strengthened by more than 50%. It is assumed that Dogecoin (DOGE) will further dominate the bullish trend if the 3,600-4,000 area can form a candle and Dogecoin (DOGE) will touch the highest price since December 2021.
2. Origin Protocol (OGN)

In the 1-day timeframe, Origin Protocol (OGN) has been in the bullish zone since October 31, 2023. Origin Protocol (OGN) indicated that it is still holding above the WMA/85 with the direction of price movement and will try to break from the 4,500-5,500 area with the next level available in the dominant 6,000-7,500 area.
3. Litecoin (LTC)

The price of 1,700,000-1,800,000 is a level that if Litecoin (LTC) can pass, then the possibility of the trend being able to strengthen to the next area range, namely 2,400,000-2,700,000, is getting bigger. The trend in 1 Day by the MACD indicator indicates that Litecoin (LTC) is still in a positive area.
4. SushiSwap (SUSHI)

SushiSwap (SUSHI) needs more time to confirm the direction of price movement and determine whether the direction of the lines of the MACD indicator will cross positively or vice versa. The support area of SushiSwap (SUSHI) is indicated at 20,000-22,000, and if it is broken, the bullish momentum will be under pressure.
5. Bitcoin Cash (BCH)

It had a correction, but Bitcoin Cash (BCH) experienced a pullback to break the 7,300,000-8,000,000 resistance area, which was previously a fairly strong area. The next strengthening of Bitcoin Cash (BCH) will try to test the strength of 10,000,000-12,000,000, where this price is quite wide.
5 Bearish Crypto Assets
1. Giant Mammoth (GMMT)

The trend of Giant Mammoth (GMMT) in the 4-hour timeframe is still indicated to be in the bullish zone, even if the downward trend cannot be corrected. Candles below the WMA/75 create negative pressure for Giant Mammoth (GMMT). The weakening trend will deepen if the support area of 4,500-5,000 cannot hold the candle from moving below the area; Giant Mammoth (GMMT) will touch its lowest price.
2. Efforce (WOZX)
 Since touching the 67-80 price area, which is the lowest price for Efforce (WOZX) while traded on INDODAX, Efforce (WOZX) has been able to move up to repair the weakening trend. If the 170-240 level can be broken, then the opportunity for a candle to be created above the EMA/200 is quite large.
3. ABBC Coin (ABBC)

Although the MACD indicator has not confirmed the direction of trend movement and needs more time to confirm, the price of ABBC Coin (ABBC) has experienced a weakening where the 400 level is a fairly crucial level for ABBC Coin (ABBC).
4. Tellor (TRB)

Looking at the trend movement of Tellor (TRB), the downtrend phase is expected to fail to continue if a full candle is formed above the EMA/200, which then must be followed by the crossing of the 1,750,000-2,000,000 area so that a new trend uptrend can be confirmed, but on the contrary, if it fails, Tellor (TRB) is likely to weaken again and test the 1,100,000-1,200,000 level.
5. Chainbing (CBG)
 The trend movement on Chainbing (CBG) has not moved volatile, with prices still moving stagnantly at the 2,400-3,400 level. If Chainbing (CBG) can break positively, it has the potential for the price to move to test 5,000-6,000, and it is possible to pass the EMA/200.
NOTES:
If EMA 5 crosses the WMA 75, 85, and EMA 200 lines, and these lines intersect from bottom to top, then the market trend tends to be upward (bullish).
Each table above shows that when the value of EMA 5 is higher than WMA 75,85 and EMA 200, the market tends to rise (bullish).
If the RSI and MACD values show the same condition, the market is showing the same trend; an overbought (overbought) or oversold (oversold) condition indicates that the market is at the point of changing trend direction.
 Market

